3 Assessment Design and Development
Chapter 3 of the Dynamic Learning Maps® (DLM®) Alternate Assessment System 2021–2022 Technical Manual—Year-End Model (Dynamic Learning Maps Consortium, 2022) describes assessment design and development procedures. This chapter provides an overview of updates to assessment design and development for 2024–2025. The chapter first provides a high-level overview of the assessment design. The chapter then provides an overview of 2024–2025 testlet and item writing and the 2024–2025 external review of items and testlets based on criteria for content and fairness. The chapter presents evidence of item quality, including summaries of field test data analysis and associated reviews, the pool of operational testlets available for administration, and an evaluation of differential item functioning (DIF). We additionally include test administrator survey responses on perceptions of assessment content, including new analyses of longitudinal response trends over time.
3.1 Assessment Structure
The DLM Alternate Assessment System uses learning maps as the basis for assessment. Learning maps are highly connected representations of how academic skills are acquired as reflected in the research literature. Nodes in the maps represent specific knowledge, skills, and understandings in English language arts (ELA) and mathematics, as well as important foundational skills that provide an understructure for academic skills. The maps go beyond traditional learning progressions to include multiple pathways by which students develop content knowledge and skills.
Four broad claims were developed for ELA and mathematics, which were then subdivided into nine conceptual areas, to organize the highly complex learning maps. For a complete description, see Chapter 2 of the 2021–2022 Technical Manual—Year-End Model (Dynamic Learning Maps Consortium, 2022). Claims are overt statements of what students are expected to learn and be able to demonstrate as a result of mastering skills within a very large neighborhood of the map. Conceptual areas are nested within claims and comprise multiple conceptually related content standards and the nodes that support and extend beyond the standards. The claims and conceptual areas apply to all grades in the DLM system.
Essential Elements (EEs) are specific statements of knowledge and skills, analogous to alternate or extended content standards. The EEs were developed by linking to the grade-level expectations identified in the Common Core State Standards. The purpose of the EEs is to build a bridge from the Common Core State Standards to academic expectations for students with the most significant cognitive disabilities.
For each EE, five linkage levels—small collections of nodes that represent critical junctures on the path toward and beyond the learning target—were identified in the map. Assessments are developed at each linkage level for a particular EE.
Testlets are the basic units of measurement in the DLM system. Testlets are short measures of student knowledge, skills, and understandings. Each testlet is made up of three to nine assessment items. Assessment items are developed based on nodes at the five linkage levels for each EE. Each testlet measures an EE and linkage level, with the exception of writing testlets. See Chapter 4 of 2021–2022 Technical Manual—Year-End Model (Dynamic Learning Maps Consortium, 2022) for a description of writing testlets. The Target linkage level reflects the grade-level expectation aligned directly to the EE. For each EE, small collections of nodes are identified earlier in the map that represent critical junctures on the path toward the grade-level expectation. Nodes are also identified beyond the Target at the Successor level to give students an opportunity to grow toward the grade-level targets for students without significant cognitive disabilities.
There are three levels below the Target and one level beyond the Target.
- Initial Precursor
- Distal Precursor
- Proximal Precursor
- Target
- Successor
3.2 Testlet and Item Writing
This section describes information pertaining to item writing and item writer demographics for the 2024–2025 year. For a complete summary of item and testlet development procedures, see Chapter 3 of the 2021–2022 Technical Manual—Year-End Model (Dynamic Learning Maps Consortium, 2022).
3.2.1 2025 Testlet and Item Writing
Item development for 2024–2025 focused on replenishing and increasing the pool of testlets in all subjects. External item writers and internal test development staff develop items. External item writers are recruited to write computer-delivered items and testlets. Teacher-administered testlets are based on templates created in partnership with Karen Erickson from the Center for Literacy and Disability Studies at the University of North Carolina. These templates are created specifically for students with presymbolic communication and are used at the Initial Precursor linkage level. Because the templates are already created, Accessible Teaching, Learning, and Assessment Systems (ATLAS) staff produced all ELA and mathematics teacher-administered testlets internally.
3.2.1.1 Item-Writing Process
In January 2025, item writers and staff met online for a multiday virtual item-writing workshop. During the workshop, item writers received training and worked on producing and peer reviewing two computer-delivered testlets. Following the virtual workshop, item writers continued producing and peer reviewing computer-delivered testlets virtually via a secure online platform through April 2025. Following item writing, ATLAS staff internally review items and testlets ahead of external review.
3.2.1.2 Item Writers
Item writers were selected from the ATLAS MemberClicks database. The database is a profile-based recruitment tool hosted in MemberClicks and includes individuals recruited via the DLM governance board and social media, individuals who have previously participated in item writing and other events, and individuals who created profiles via the “sign up to participate in DLM events” link on the DLM homepage. Interested individuals create and update their participant profile. Participant profiles include demographic, education, and work experience data.
On the basis of the profiles, a total of 233 individuals were initially invited to participate in the 2025 item-writing workshop using the ATLAS MemberClicks database. Minimum eligibility criteria included at least 2 years of teaching experience in their assigned content area or with students from the DLM population, teaching experience in their assigned grade band, and teaching in a DLM state. Prior DLM event participation, most recent teaching experience, and distribution of experience in each grade band were also considered in selection and assignment to a subject area. Of the 233 individuals initially invited to participate, 38 individuals registered, completed a prereading task, and committed to attend the workshop. New item writers were invited to a first-day training that focused on the basics of DLM and item writing. Five mathematics item writers and seven ELA item writers attended this first-day training. Veteran item writers joined new item writers for another 2 days to complete the item-writing workshop. All 38 registered item writers attended the 2 days of the item-writing training workshop where they learned about the DLM assessment system, EEs and linkage levels, and how to write testlets. They also completed at least Rounds 1 and 2 of item writing. Of these item writers, 18 developed ELA testlets and 20 developed mathematics testlets.
Table 3.1 presents the item writer demographics. While staff sought a diverse sample, most item writers were female, white, and of non-Hispanic ethnicity. Table 3.2 shows the median and range of years of teaching experience for item writers. Item writers had expertise across Grades 3–8 and high school, as shown in Table 3.3.
| Subgroup | n | % |
|---|---|---|
| Gender | ||
| Female | 36 | 94.7 |
| Male | 2 | 5.3 |
| Race | ||
| White | 36 | 94.7 |
| Black or African American | 1 | 2.6 |
| Chose not to disclose | 1 | 2.6 |
| Hispanic ethnicity | ||
| Non-Hispanic | 36 | 94.7 |
| Chose not to disclose | 2 | 5.3 |
| Teaching experience | n | Median (years) | Range (years) |
|---|---|---|---|
| Pre-K–12 | 27 | 20.0 | 5–34 |
| English language arts | 26 | 19.5 | 5–30 |
| Mathematics | 26 | 18.0 | 2–32 |
| Note. Not all item writers provided their years of teaching experience. |
| Grade level | n | % |
|---|---|---|
| 3 | 17 | 44.7 |
| 4 | 22 | 57.9 |
| 5 | 21 | 55.3 |
| 6 | 21 | 55.3 |
| 7 | 22 | 57.9 |
| 8 | 23 | 60.5 |
| High school | 15 | 39.5 |
| Note. Item writers could indicate multiple grade levels. |
The 38 item writers represented a highly qualified group of professionals with both content and special education perspectives. Table 3.4 shows the degrees held by item writers. All item writers held at least a bachelor’s degree. The vast majority (n = 35; 92%) also held a master’s degree or higher.
| Degree | n | % |
|---|---|---|
| Bachelor’s degree | 38 | 100.0 |
| Education | 14 | 36.8 |
| Special education | 10 | 26.3 |
| Other | 12 | 31.6 |
| Missing | 2 | 5.3 |
| Master’s degree or higher | 35 | 92.1 |
| Education | 10 | 28.6 |
| Special education | 23 | 65.7 |
| Other | 2 | 5.7 |
Item writers reported a range of experience working with students with disabilities, as summarized in Table 3.5. Item writers collectively had the most experience working with students with multiple disabilities (n = 35; 92%) or a significant cognitive disability (n = 35; 92%).
| Disability category | n | % |
|---|---|---|
| Multiple disabilities | 35 | 92.1 |
| Significant cognitive disability | 35 | 92.1 |
| Mild cognitive disability | 32 | 84.2 |
| Other health impairment | 32 | 84.2 |
| Specific learning disability | 31 | 81.6 |
| Speech impairment | 30 | 78.9 |
| Emotional disability | 29 | 76.3 |
| Blind/low vision | 21 | 55.3 |
| Deaf/hard of hearing | 19 | 50.0 |
| Traumatic brain injury | 19 | 50.0 |
| Orthopedic impairment | 18 | 47.4 |
| Note. Item writers could select multiple categories. |
Table 3.6 shows the professional roles reported by the item writers. While item writers had a range of professional roles, they were primarily classroom educators.
| Role | n | % |
|---|---|---|
| Classroom educator | 28 | 73.7 |
| Instructional coach | 4 | 10.5 |
| State education agency | 2 | 5.3 |
| University faculty/staff | 2 | 5.3 |
| District staff | 1 | 2.6 |
| Other | 1 | 2.6 |
Item writers came from 16 different states. Instructionally Embedded and Year-End models share an item pool; therefore, item writers were recruited from all DLM states. Table 3.7 reports the geographic areas of the institutions in which item writers taught or held a position.
| Geographic area | n | % |
|---|---|---|
| Rural | 16 | 42.1 |
| Suburban | 14 | 36.8 |
| Urban | 8 | 21.1 |
| Note. Rural: <2,000; Suburban: 2,000–50,000; Urban: >50,000 |
3.2.1.3 Results of Item Writing
Item writers produced a total of 231 computer-delivered testlets (111 in ELA and 120 in mathematics) across all grades and 58 EEs (24 EEs in ELA and 34 EEs in mathematics). DLM staff produced a total of 80 teacher-administered testlets (48 in ELA and 32 in mathematics). Across computer-delivered and teacher-administered testlets, item writers and DLM staff produced testlets for all grades and EEs for both ELA and mathematics.
3.2.2 External Reviews
Following rounds of internal review and revision, items and testlets were externally reviewed. For a complete summary of item and testlet review procedures, see Chapter 3 of the 2021–2022 Technical Manual—Year-End Model (Dynamic Learning Maps Consortium, 2022).
3.2.2.1 Items and Testlets
External review of testlets was held on site during June and July of 2024 in Providence, Rhode Island. The content and fairness reviews of all items and testlets were conducted across 2–5 days. In prior years, panels have included both a bias and sensitivity panel as well as an accessibility panel. The criteria for these two panels overlapped, and the reviews resulted in very similar feedback. Due to this, the criteria for both panels were combined into a single fairness panel. The fairness panel reviewed all subjects and grade bands during their allotted time. The fairness reviews were conducted across 5 days because of the need to review testlets and items for all subjects and grade bands.
The purpose of external reviews of items and testlets is to evaluate whether items and testlets measure the intended content, are accessible, and are free of bias or sensitive content. External reviewers use external review criteria established for DLM alternate assessments to rate items and recommend to accept, revise, or reject items and testlets. External reviewers provide recommendations for revise ratings and explanations for reject ratings. The test development team uses collective feedback from the external reviewers to inform decisions about items and testlets prior to field testing.
3.2.2.1.1 Overview of Review Process
External reviewers were selected from the ATLAS MemberClicks database based on predetermined qualifications for each panel type. To qualify as an external reviewer, the individual must be from a DLM state, have at least 1 year of teaching experience, and must not have been an item writer for DLM within the past 3 years. External reviewers were assigned to content or fairness panels based on additional qualifications, such as expertise in certain grade bands, subjects, or with the DLM population. Each external reviewer only serves on one of these panels.
There were 58 external reviewers. Of those, 25 were ELA external reviewers and 18 were mathematics external reviewers. There were also 15 fairness external reviewers who reviewed items and testlets from all subjects.
Prior to attending the in-person event, external reviewers were sent an email with instructions regarding accessing the platform used for their reviews. Each external reviewer was asked to access the platform and to read a guide about external review before attending the event. Each panel was led by an ATLAS facilitator and co-facilitator. Facilitators provided additional training on the platform used for reviews and criteria used to review items and testlets. External reviewers began their reviews by engaging in a calibration collection (reviewing two testlets) to calibrate their ratings for the review. Following the calibration collections, external reviewers reviewed collections of items and testlets independently. Once all external reviewers completed the review, facilitators used a discussion framework known as the Rigorous Item Feedback framework (Wine & Hoffman, 2021) to discuss any items or testlets that were rated either revise or reject by an external reviewer to obtain collective feedback about those items and testlets. The Rigorous Item Feedback framework helps facilitators elicit detailed, substantive feedback from external reviewers and record feedback in a uniform fashion. Following the discussion, external reviewers were given another collection of items and testlets to review. This process was repeated until all collections of items and testlets were reviewed. Collections ranged from one to 26 testlets, depending on the panel type. Content panels had fewer testlets per collection, and collections were organized by grade level. Because fairness panels were reviewing testlets for all subjects and had more testlets overall to review, these panels had more testlets per collection. Each testlet underwent two rounds of review: one round with the content panel and one round with the fairness panel.
3.2.2.1.2 External Reviewers
Table 3.8 presents the demographics for the external reviewers. Table 3.9 shows the median and range of years of teaching experience. External reviewers had expertise across all grade levels, as shown in Table 3.10. External reviewers had varying experience teaching students with the most significant cognitive disabilities. External reviewers had a median of 4 years of experience teaching students with the most significant cognitive disabilities, with a minimum of 0 years and a maximum of 28 years of experience.
| Subgroup | n | % |
|---|---|---|
| Gender | ||
| Female | 52 | 89.7 |
| Male | 6 | 10.3 |
| Race | ||
| White | 49 | 84.5 |
| African American | 3 | 5.2 |
| Chose not to disclose | 2 | 3.4 |
| American Indian | 1 | 1.7 |
| Asian | 1 | 1.7 |
| Native Hawaiian or Pacific Islander | 1 | 1.7 |
| Other | 1 | 1.7 |
| Hispanic ethnicity | ||
| Non-Hispanic | 56 | 96.6 |
| Hispanic | 1 | 1.7 |
| Chose not to disclose | 1 | 1.7 |
| Teaching experience | n | Median (years) | Range (years) |
|---|---|---|---|
| Pre-K–12 | 27 | 17.0 | 2–31 |
| English language arts | 32 | 11.5 | 0–31 |
| Mathematics | 28 | 15.0 | 0–31 |
| Note. Not all reviewers provided their years of teaching experience. |
| Grade level | n | % |
|---|---|---|
| 3 | 22 | 37.9 |
| 4 | 23 | 39.7 |
| 5 | 28 | 48.3 |
| 6 | 30 | 51.7 |
| 7 | 34 | 58.6 |
| 8 | 37 | 63.8 |
| High school | 32 | 55.2 |
| Note. Reviewers could indicate multiple grade levels. |
The 58 external reviewers represented a highly qualified group of professionals. The level of degree and most common types of degrees held by external reviewers are shown in Table 3.11. A majority (n = 54; 93%) held a master’s degree or higher.
| Degree | n | % |
|---|---|---|
| Bachelor’s degree | 58 | 100.0 |
| Education | 22 | 37.9 |
| Special education | 9 | 15.5 |
| Other | 24 | 41.4 |
| Missing | 3 | 5.2 |
| Master’s degree or higher | 54 | 93.1 |
| Education | 32 | 59.3 |
| Special education | 14 | 25.9 |
| Other | 8 | 14.8 |
External reviewers reported a range of experience working with students with disabilities, as summarized in Table 3.12. Most external reviewers had experience working with students with disabilities (97%), and 43% had experience with the administration of alternate assessments. The variation in responses suggests some item writers may have had experience working with students with disabilities but perhaps did not participate in the administration of alternate assessments for students with the most significant cognitive disabilities. Given that some external reviewers were recruited for their subject-matter expertise to serve on content panels, this is not an unexpected finding.
| Disability category | n | % |
|---|---|---|
| Emotional disability | 45 | 77.6 |
| Specific learning disability | 45 | 77.6 |
| Mild cognitive disability | 42 | 72.4 |
| Speech impairment | 41 | 70.7 |
| Multiple disabilities | 39 | 67.2 |
| Other health impairment | 39 | 67.2 |
| Significant cognitive disability | 39 | 67.2 |
| Blind/low vision | 27 | 46.6 |
| Traumatic brain injury | 24 | 41.4 |
| Orthopedic impairment | 21 | 36.2 |
| Deaf/hard of hearing | 15 | 25.9 |
| Note. Reviewers could select multiple categories. |
Table 3.13 shows the professional roles reported by the external reviewers. While the reviewers had a range of professional roles, they were primarily classroom educators.
| Role | n | % |
|---|---|---|
| Classroom educator | 39 | 67.2 |
| Instructional coach | 10 | 17.2 |
| Other | 6 | 10.3 |
| District staff | 3 | 5.2 |
External reviewers were from 15 different states. Instructionally Embedded and Year-End models share an item pool; therefore, item writers were recruited from all DLM states. Table 3.14 reports the geographic areas of institutions in which reviewers taught or held a position.
| Geographic area | n | % |
|---|---|---|
| Urban | 20 | 34.5 |
| Rural | 19 | 32.8 |
| Suburban | 19 | 32.8 |
| Note. Rural: <2,000; Suburban: 2,000–50,000; Urban: >50,000 |
3.2.2.1.3 Results of External Reviews
Table 3.15 presents the percentage of items and testlets rated as accept, revise, and reject across panels and rounds of review by subject. Most items and testlets were rated as accept or revise; a very small percentage of items and testlets received a reject rating.
|
Content panel
|
Fairness panel
|
|||||||||||
|---|---|---|---|---|---|---|---|---|---|---|---|---|
|
Accept
|
Revise
|
Reject
|
Accept
|
Revise
|
Reject
|
|||||||
| Subject | n | % | n | % | n | % | n | % | n | % | n | % |
| English language arts | ||||||||||||
| Items | 849 | 70 | 359 | 30 | 7 | 1 | 973 | 80 | 175 | 14 | 67 | 6 |
| Testlets | 191 | 79 | 50 | 21 | 2 | 1 | 156 | 64 | 73 | 30 | 14 | 6 |
| Mathematics | ||||||||||||
| Items | 649 | 47 | 722 | 53 | 4 | <1 | 940 | 68 | 429 | 31 | 6 | <1 |
| Testlets | 157 | 57 | 117 | 43 | 1 | <1 | 196 | 71 | 78 | 28 | 1 | <1 |
3.2.2.1.4 Test Development Team Decisions
Because each item and testlet is examined by two panels, ratings are compiled across panels, following the process described in Chapter 3 of the 2021–2022 Technical Manual—Year-End Model (Dynamic Learning Maps Consortium, 2022). The test development team reviews the collective feedback provided by external reviewers for each item and testlet. Once the test development team views each item and testlet and considers the feedback provided by the external reviewers, it assigns one of the following decisions to each one: (a) accept as is; (b) minor revision, pattern of minor concerns, will be addressed; (c) major revision needed; (d) reject; and (e) more information needed.
The ELA test development team accepted 136 (56%) of testlets and 922 (76%) of items as is. Apart from making no changes to items and testlets that were approved as is, the ELA test development team frequently avoided making changes to items that were cosmetic or preferential. For example, if a committee suggested a style change that conflicted with ATLAS style guide requirements, that request was not applied; further, swapping words or distractors with replacements that did not improve the item construction (e.g., stems that addressed targeted cognition, response options grounded in misconceptions) were likewise not applied. Of the items and testlets that were revised, most required major changes (e.g., stem or response option replaced) as opposed to minor changes (e.g., minor rewording but concept remained unchanged). The ELA test development team made 61 (5%) minor revisions and 232 (19%) major revisions; they rejected no testlets. Comments for testlets rated as reject by the external reviewers were addressed through major revisions.
The mathematics test development team accepted 222 (81%) of testlets and 692 (50%) of items as is. Testlet-level comments from external reviewers that resulted in revisions to items were made at the item level, and the testlet was marked as accept as is. Items with comments that would deviate from established methods of assessing nodes were accepted as is, and other comments were discussed by the mathematics test development team. Of the items and testlets that were revised, most required major changes (e.g., stem or response option replaced) as opposed to minor changes (e.g., minor rewording but concept remained unchanged). The mathematics test development team made 58 (4%) minor revisions and 609 (44%) major revisions to items; they rejected three (1%) testlets.
Most of the items and testlets reviewed will be field tested during the fall 2025 or spring 2026 assessment windows.
3.3 Evidence of Item Quality
Each year, testlets are added to and removed from the operational pool to maintain a pool of high-quality testlets. The following sections describe evidence of item quality, including evidence about field test testlets available for administration, a summary of the operational pool, and evaluation of DIF.
3.3.1 Field Testing
During 2024–2025, field test testlets were administered to evaluate item quality before promoting testlets to the operational pool. Adding testlets to the operational pool allows for multiple testlets to be available in the instructionally embedded and spring assessment windows for a given EE and linkage level combination. This allows teachers to assess the same EE and linkage level multiple times in the instructionally embedded window, if desired, and reduces item exposure for the EEs and linkage levels that are assessed most frequently. Additionally, deepening the operational pool allows for testlets to be evaluated for retirement in instances in which other testlets show better performance.
In this section, we describe the field test testlets administered in 2024–2025 and the associated review activities. A summary of prior field test events can be found in Chapter 3 of the 2021–2022 Technical Manual—Year-End Model (Dynamic Learning Maps Consortium, 2022) and the subsequent technical manual updates (Dynamic Learning Maps Consortium, 2023, 2024).
3.3.1.1 Description of Field Tests Administered in 2024–2025
The Instructionally Embedded and Year-End assessment models share a common item pool. Testlets field tested during the fall instructionally embedded assessment window may be eventually promoted to the spring assessment window. Therefore, field testing from both assessment windows is described.
Testlets were made available for field testing based on the availability of field test content for each EE and linkage level. Because field-test testlets are assigned after completion of the operational assessment and Year-End model students only test in the spring, testing during the instructionally embedded window is optional, so no field tests were administered to students from states adopting the Year-End model during the fall window. However, field tests were completed by students from states participating in the Instructionally Embedded model.
During the spring assessment window, field test testlets were administered to each student after completion of the operational assessment. A field test testlet was assigned for an EE that was assessed during the operational assessment at a linkage level equal or adjacent to the linkage level of the operational testlet.
Table 3.16 summarizes the number of field test testlets available during 2024–2025. A total of 322 field test testlets were available across grades, subjects, and windows.
|
Instructionally embedded
assessment window |
Spring assessment window
|
|||
|---|---|---|---|---|
| Grade | English language arts (n) | Mathematics (n) | English language arts (n) | Mathematics (n) |
| 3 | 10 | 17 | 11 | 18 |
| 4 | 9 | 5 | 10 | 5 |
| 5 | 8 | 4 | 6 | 5 |
| 6 | 13 | 8 | 12 | 8 |
| 7 | 9 | 5 | 6 | 6 |
| 8 | 8 | 4 | 9 | 5 |
| 9 | 14 | 5 | 13 | 8 |
| 10 | 14 | 2 | 13 | 4 |
| 11 | 10 | 6 | 6 | 2 |
| 12 | 10 | 6 | 6 | 2 |
| Note. In mathematics, high school is banded in Grades 9–12. | ||||
Table 3.17 presents the demographic breakdown of students completing at least one field test testlet in ELA and mathematics in 2024–2025. Consistent with the DLM population, approximately 67% of students completing field test testlets were male, approximately 55% were White, and approximately 75% were non-Hispanic. Most students completing field test testlets were not English-learner eligible or monitored. The students completing field test testlets were split across the four complexity bands, with most students assigned to Band 1 or Band 2. See Chapter 4 of this manual for a description of complexity bands.
|
English language
arts |
Mathematics
|
|||
|---|---|---|---|---|
| Demographic group | n | % | n | % |
| Gender | ||||
| Male | 57,914 | 68.1 | 55,006 | 67.9 |
| Female | 27,029 | 31.8 | 25,908 | 32.0 |
| Nonbinary/undesignated | 42 | 0.0 | 45 | 0.1 |
| Prefer not to say | 1 | 0.0 | 1 | 0.0 |
| Race | ||||
| White | 45,202 | 53.2 | 42,934 | 53.0 |
| African American | 18,599 | 21.9 | 17,343 | 21.4 |
| Two or more races | 13,643 | 16.1 | 13,321 | 16.5 |
| Asian | 5,215 | 6.1 | 5,115 | 6.3 |
| American Indian | 1,761 | 2.1 | 1,692 | 2.1 |
| Native Hawaiian or Pacific Islander | 463 | 0.5 | 444 | 0.5 |
| Alaska Native | 103 | 0.1 | 111 | 0.1 |
| Hispanic ethnicity | ||||
| Non-Hispanic | 64,566 | 76.0 | 61,120 | 75.5 |
| Hispanic | 20,420 | 24.0 | 19,840 | 24.5 |
| English learning (EL) participation | ||||
| Not EL eligible or monitored | 78,730 | 92.6 | 75,019 | 92.7 |
| EL eligible or monitored | 6,256 | 7.4 | 5,941 | 7.4 |
| English language arts complexity band | ||||
| Foundational | 17,650 | 20.8 | 16,709 | 20.6 |
| Band 1 | 29,918 | 35.2 | 28,732 | 35.5 |
| Band 2 | 26,070 | 30.7 | 25,030 | 30.9 |
| Band 3 | 11,348 | 13.4 | 10,489 | 13.0 |
| Mathematics complexity band | ||||
| Foundational | 18,035 | 21.2 | 17,062 | 21.1 |
| Band 1 | 38,113 | 44.8 | 36,580 | 45.2 |
| Band 2 | 24,657 | 29.0 | 23,903 | 29.5 |
| Band 3 | 4,181 | 4.9 | 3,415 | 4.2 |
| Note. See Chapter 4 of this manual for a description of student complexity bands. | ||||
Participation in field testing was not required, but educators were encouraged to administer all available testlets to their students. Table 3.18 shows field test participation rates for ELA and mathematics in the instructionally embedded and spring assessment windows. Note that because the Instructionally Embedded and Year-End models share an item pool, participation numbers are combined across all states. In total, 76% of students in ELA and 72% of students in mathematics completed at least one field test testlet in either window. In the instructionally embedded assessment window, 89% of field test testlets had a sample size of at least 20 students (i.e., the threshold for item review). In the spring assessment window, 93% of field test testlets had a sample size of at least 20 students.
|
Instructionally embedded
assessment window |
Spring assessment window
|
Combined
|
||||
|---|---|---|---|---|---|---|
| Subject | n | % | n | % | n | % |
| English language arts | 6,989 | 30.7 | 81,485 | 73.3 | 84,986 | 75.8 |
| Mathematics | 4,413 | 19.5 | 78,512 | 70.8 | 80,960 | 72.3 |
3.3.1.2 Field Test Data Review
Data collected during each field test are compiled and statistical flags are implemented ahead of test development team review. Items are flagged for additional review if they meet either of the following statistical criteria:
The item is potentially too challenging, as indicated by a proportion correct (p-value) less than .35. This value was selected as the threshold for flagging because most DLM assessment items offer three response options, so a value less than .35 may indicate less than chance selection of the correct response option.
The item is potentially significantly easier or harder than other items assessing the same EE and linkage level, as indicated by a weighted standardized difference greater than two standard deviations from the mean p-value for that EE and linkage level combination.
Flagging criteria serve as a source of evidence for test development teams in evaluating item quality; however, final judgments are content based, taking into account the testlet as a whole, the underlying nodes in the DLM maps that the items were written to assess, and the pool depth.
Review of field test data occurs annually during February and March. This review includes data from the immediately preceding instructionally embedded and spring assessment windows. That is, the review in February and March of 2025 includes field test data collected during the spring 2024 assessment window and the instructionally embedded assessment window of 2024–2025. Data that were collected during the 2025 spring assessment window will be reviewed in February and March of 2026, with results included in the 2025–2026 technical manual update.
Test development teams for each subject classified each reviewed item into one of four categories:
- No changes made to the item. Test development team decided the item can go forward to operational assessment.
- Test development team identified concerns that required modifications. Modifications were clearly identifiable and were likely to improve the item’s performance.
- Test development team identified concerns that required modifications. The content was worth preserving rather than rejecting. Item review may not have clearly pointed to specific modifications that were likely to improve the item.
- Rejected the item. Test development team determined the item was not worth revising.
For an item to be accepted as is, the test development team had to determine that the item was consistent with DLM item-writing guidelines and that the item was aligned to the node. An item or testlet was rejected completely if it was inconsistent with DLM item-writing guidelines, if the EE and linkage level were covered by other testlets that had better-performing items, or if there was no clear content-based revision to improve the item. In some instances, a decision to reject an item also resulted in the rejection of the testlet.
Common reasons for flagging an item for modification included items that were misaligned to the node, distractors that could be argued as partially correct, or unnecessary complexity in the language of the stem. After reviewing flagged items, the test development team looked at all items classified into Category 3 or Category 4 within the testlet to help determine whether to retain or reject the testlet. Here, the test development team could elect to keep the testlet (with or without revision) or reject it. If a revision was needed, it was assumed the testlet needed field testing again. The entire testlet was rejected if the test development team determined the flagged items could not be adequately revised.
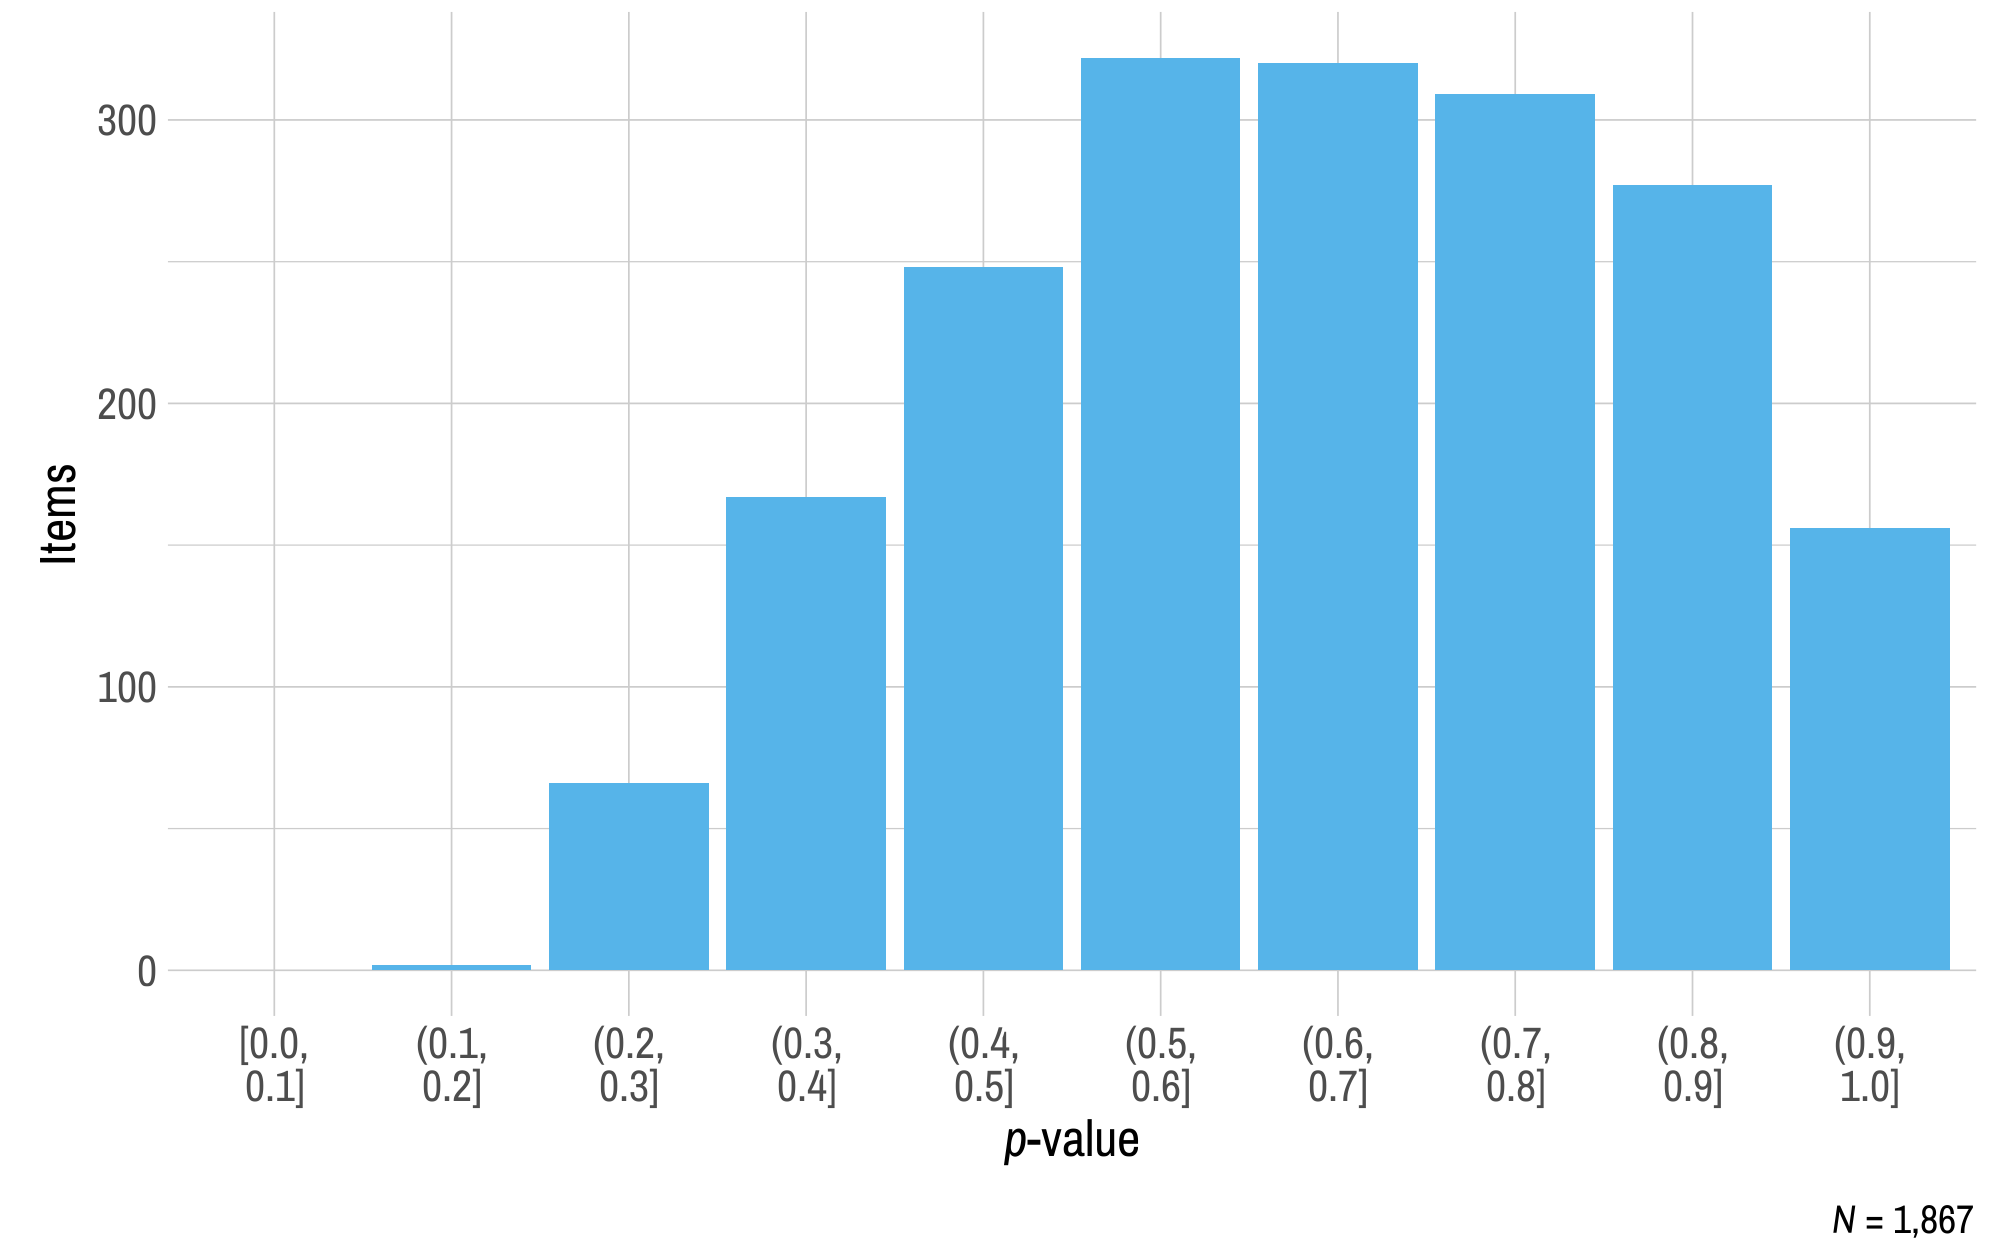
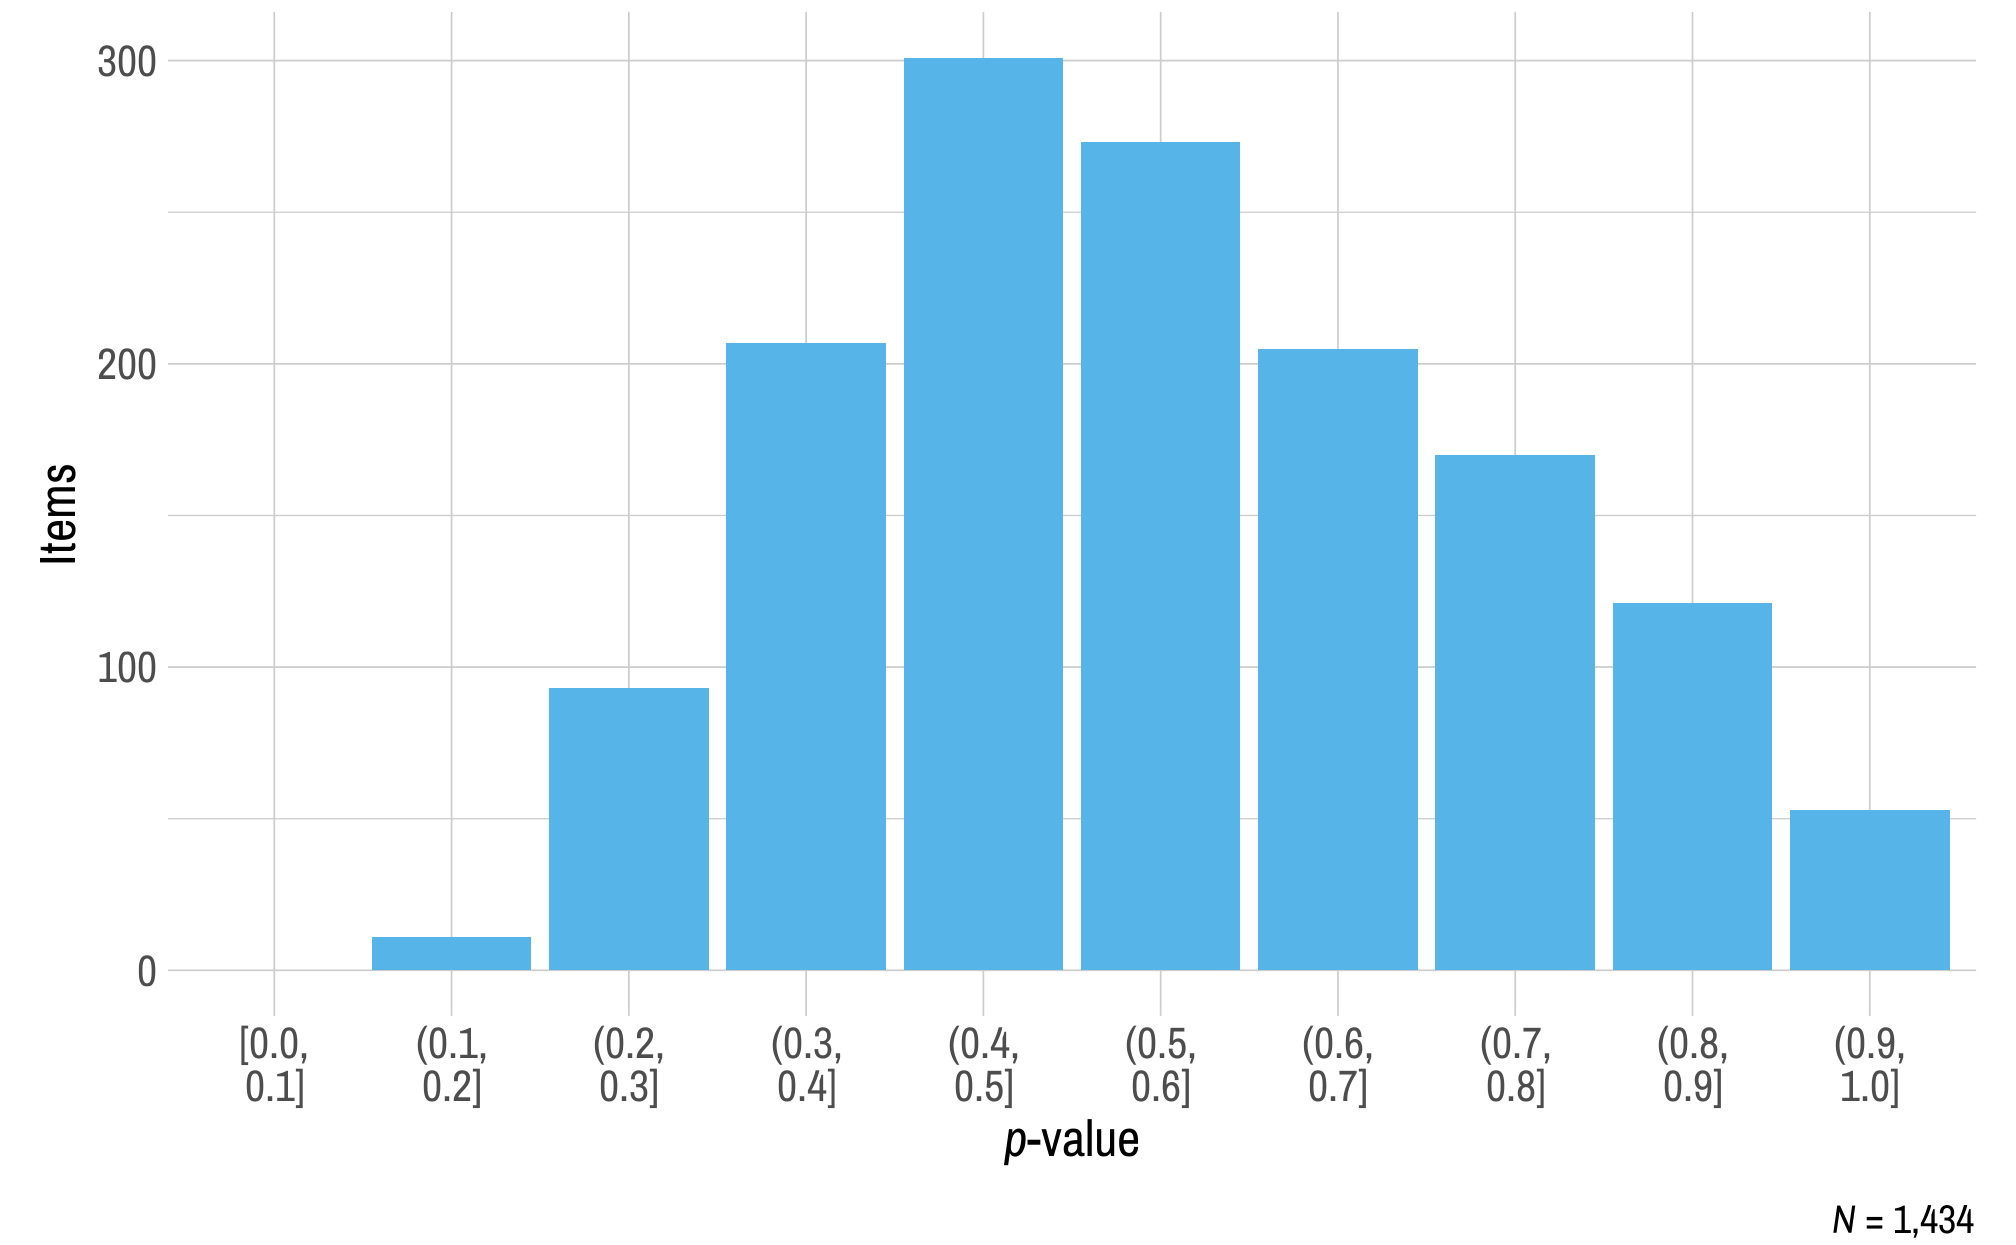
3.3.1.3 Results of Item Analysis
Figure 3.1 and Figure 3.2 summarize the p-values for items field tested during the spring 2024 assessment window and the instructionally embedded assessment window of 2024–2025 that met the minimum sample size threshold of 20. Most items fell above the .35 threshold for flagging. In ELA, 829 (91%) items were above the .35 flagging threshold. In mathematics, 530 (88%) items were above the .35 flagging threshold. All flagged items are reviewed by test development teams following field testing. Test development teams for each subject reviewed 85 (9%) items for ELA and 72 (12%) items for mathematics that were below the threshold.
Figure 3.1: p-values for English Language Arts Spring 2024 and Fall 2024–2025 Field Test Items
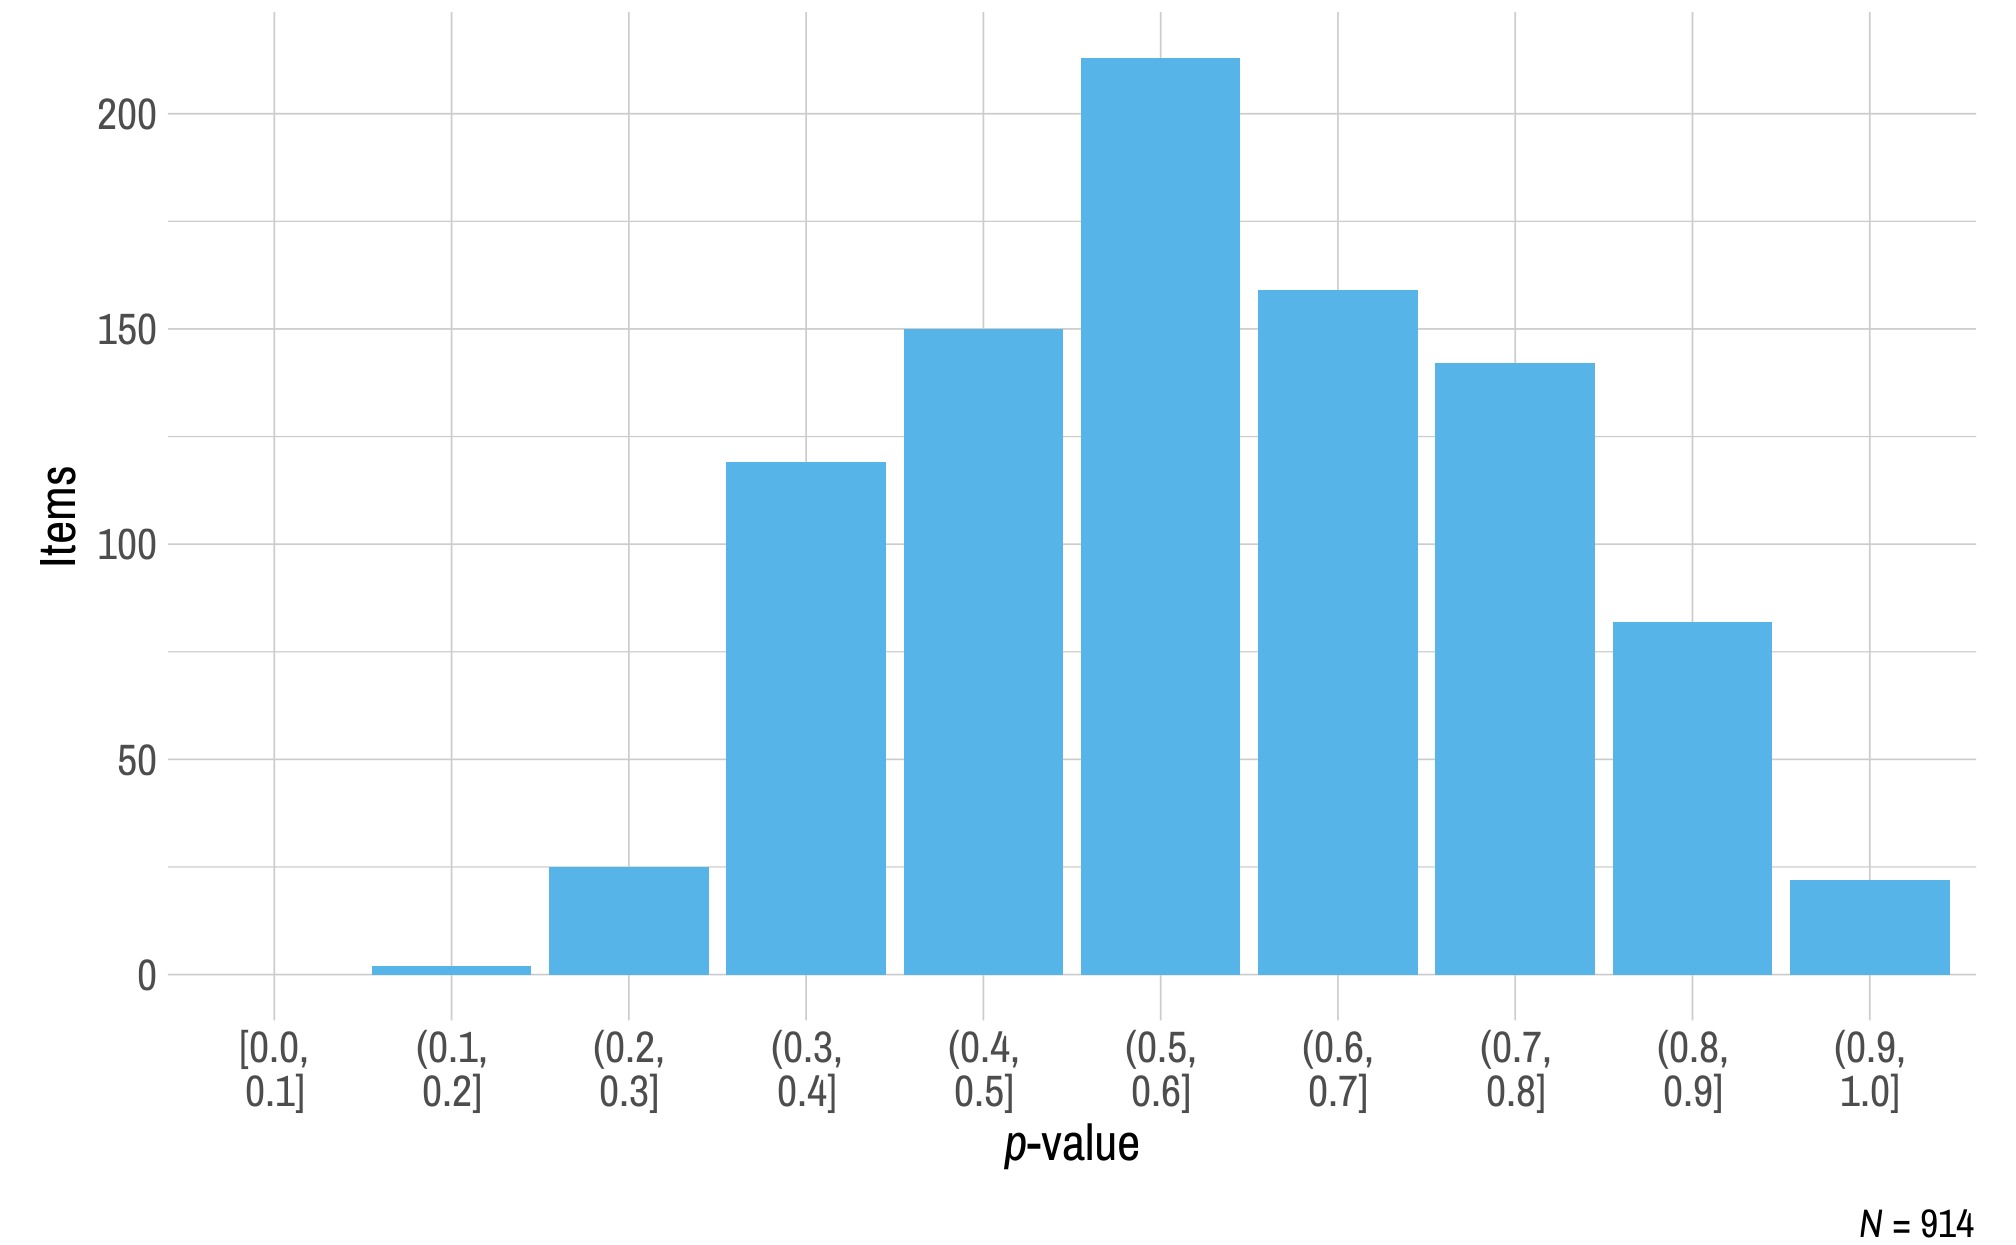
Note. Items with a sample size less than 20 were omitted.
Figure 3.2: p-values for Mathematics Spring 2024 and Fall 2024–2025 Field Test Items
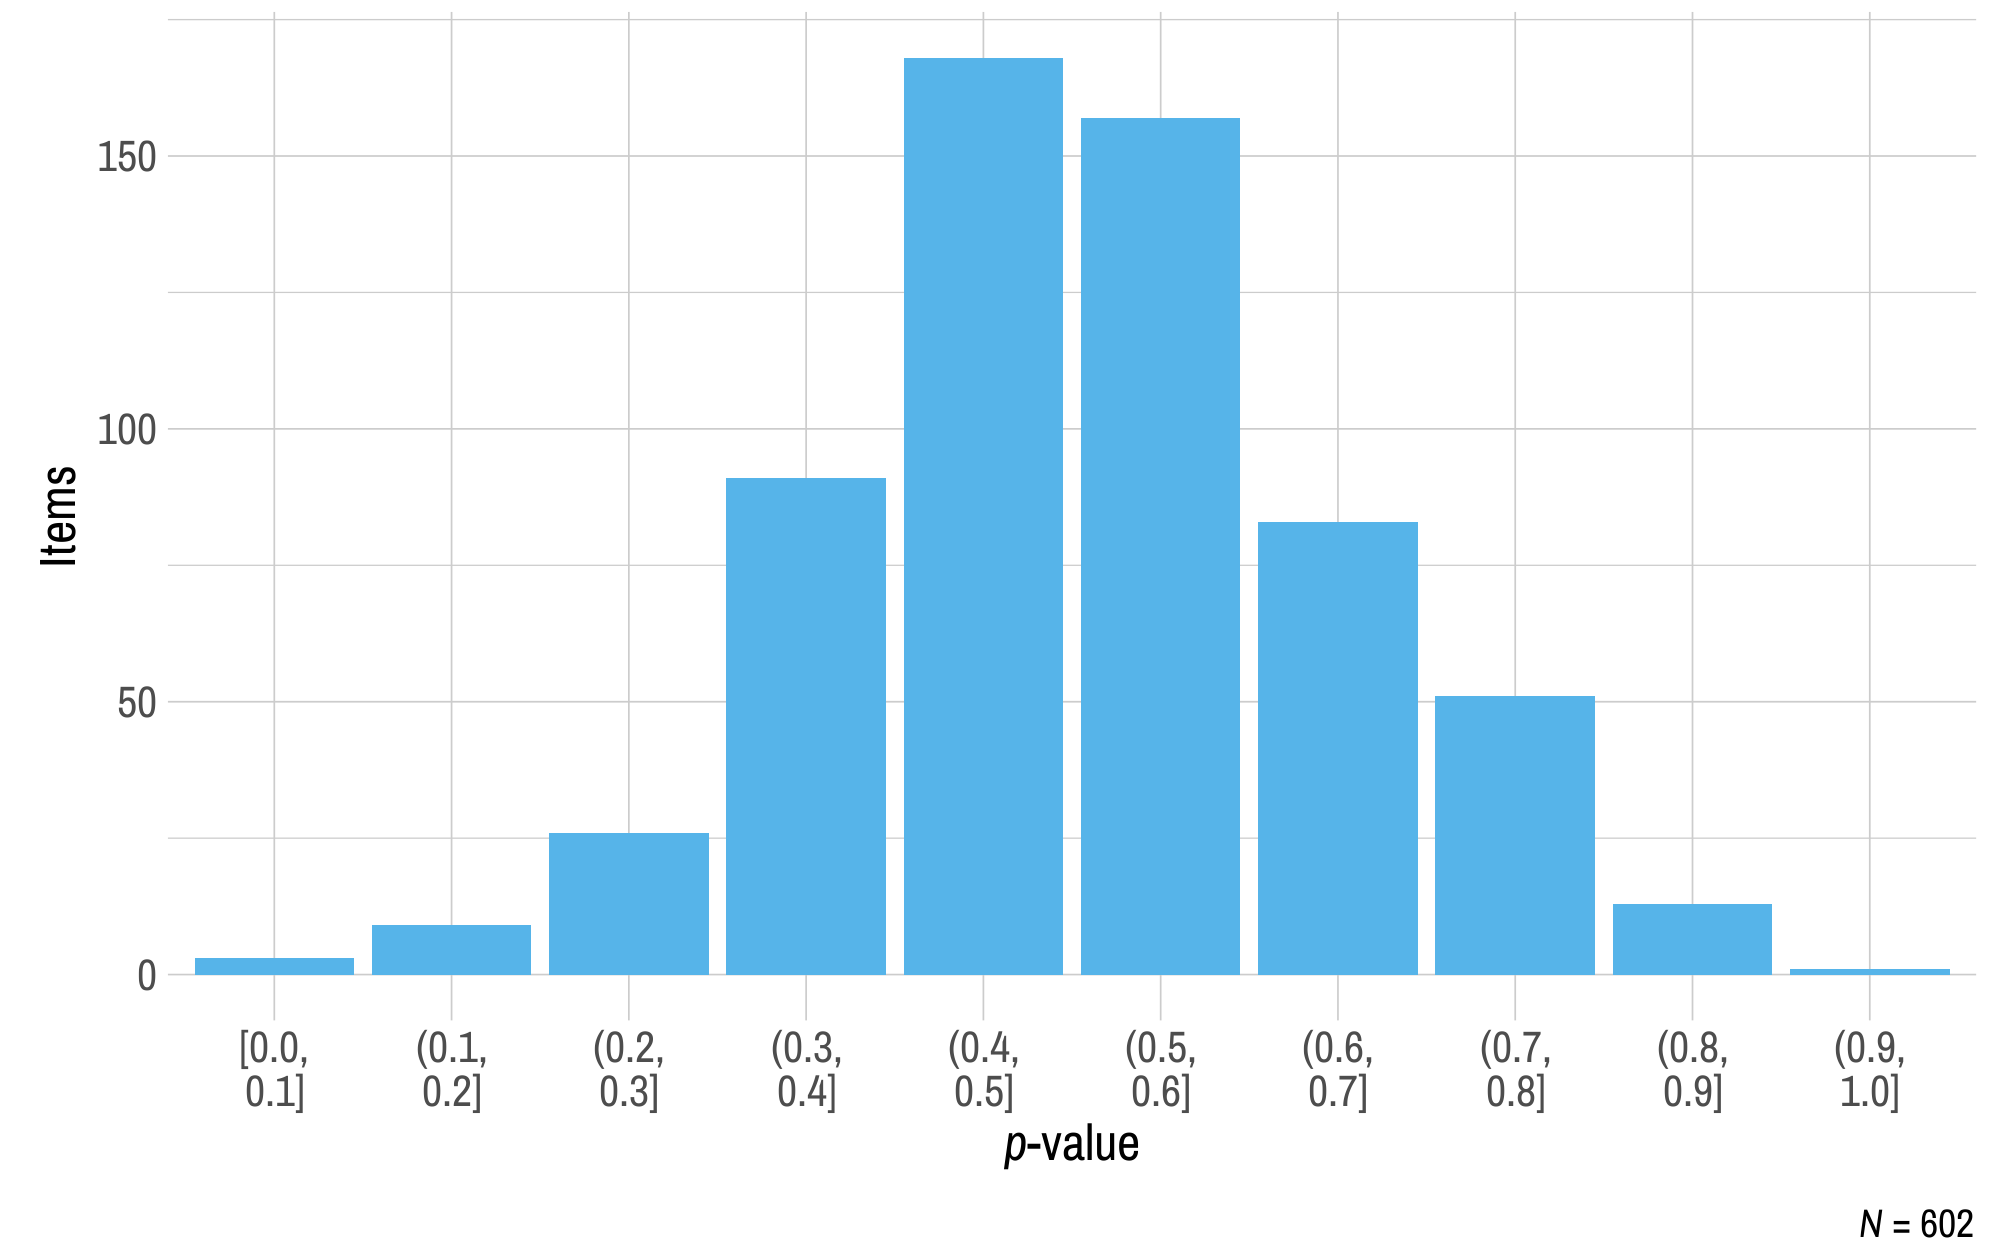
Note. Items with a sample size less than 20 were omitted.
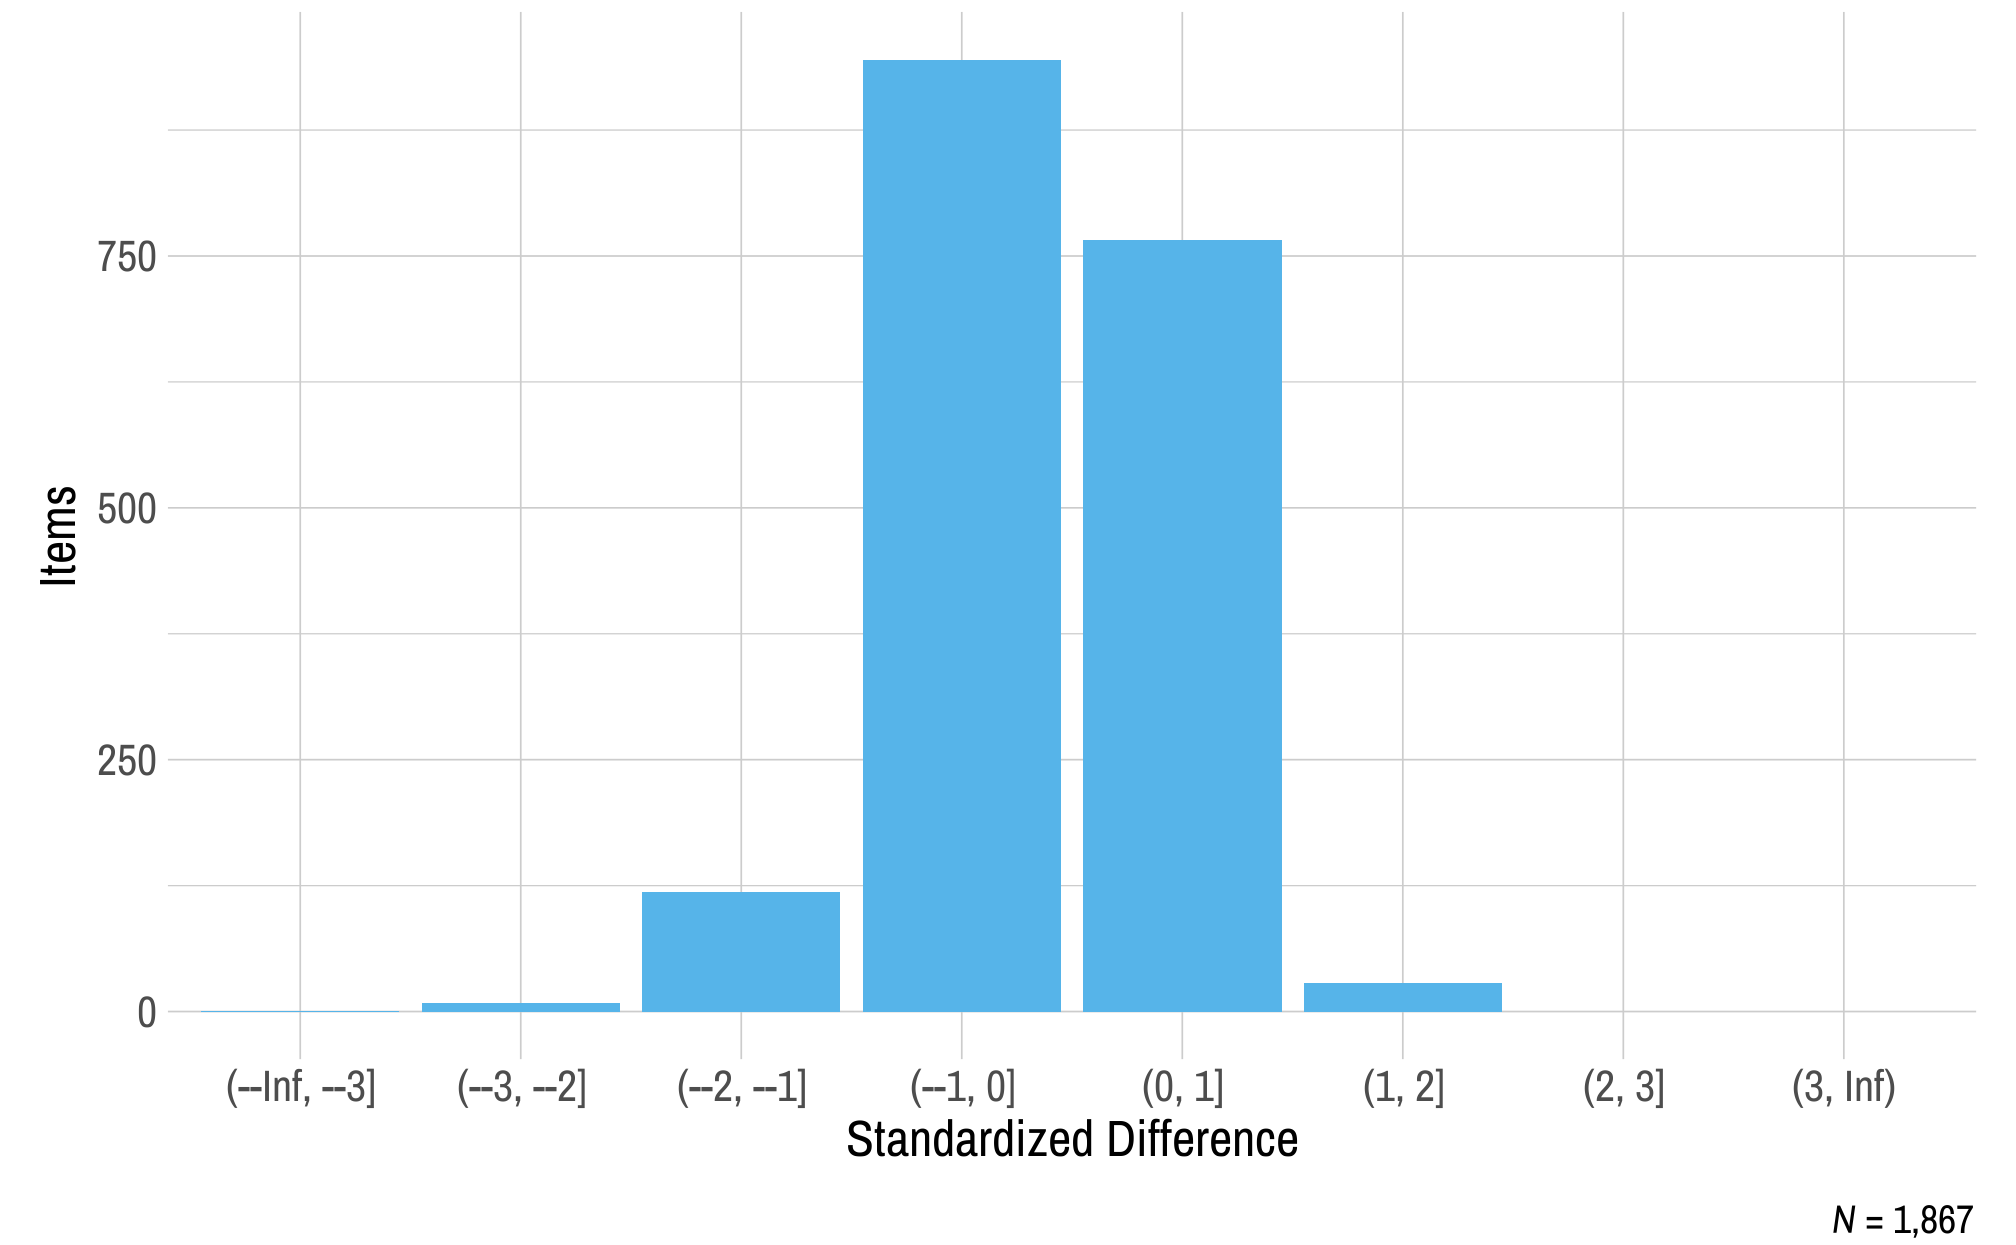
DLM assessment items are designed and developed to be fungible (i.e., interchangeable) within each EE and linkage level, meaning field test items should perform consistently with the operational items measuring the same EE and linkage level. To evaluate whether field test items perform similarly to operational items measuring the same EE and linkage level, standardized difference values are calculated for the field test items. Figure 3.3 and Figure 3.4 summarize the standardized difference values for items field tested for ELA and mathematics, respectively. Most items fell within two standard deviations of the mean for the EE and linkage level. Items beyond the threshold were reviewed by test development teams for each subject.
Figure 3.3: Standardized Difference Z-Scores for English Language Arts Spring 2024 and Fall 2024–2025 Field Test Items
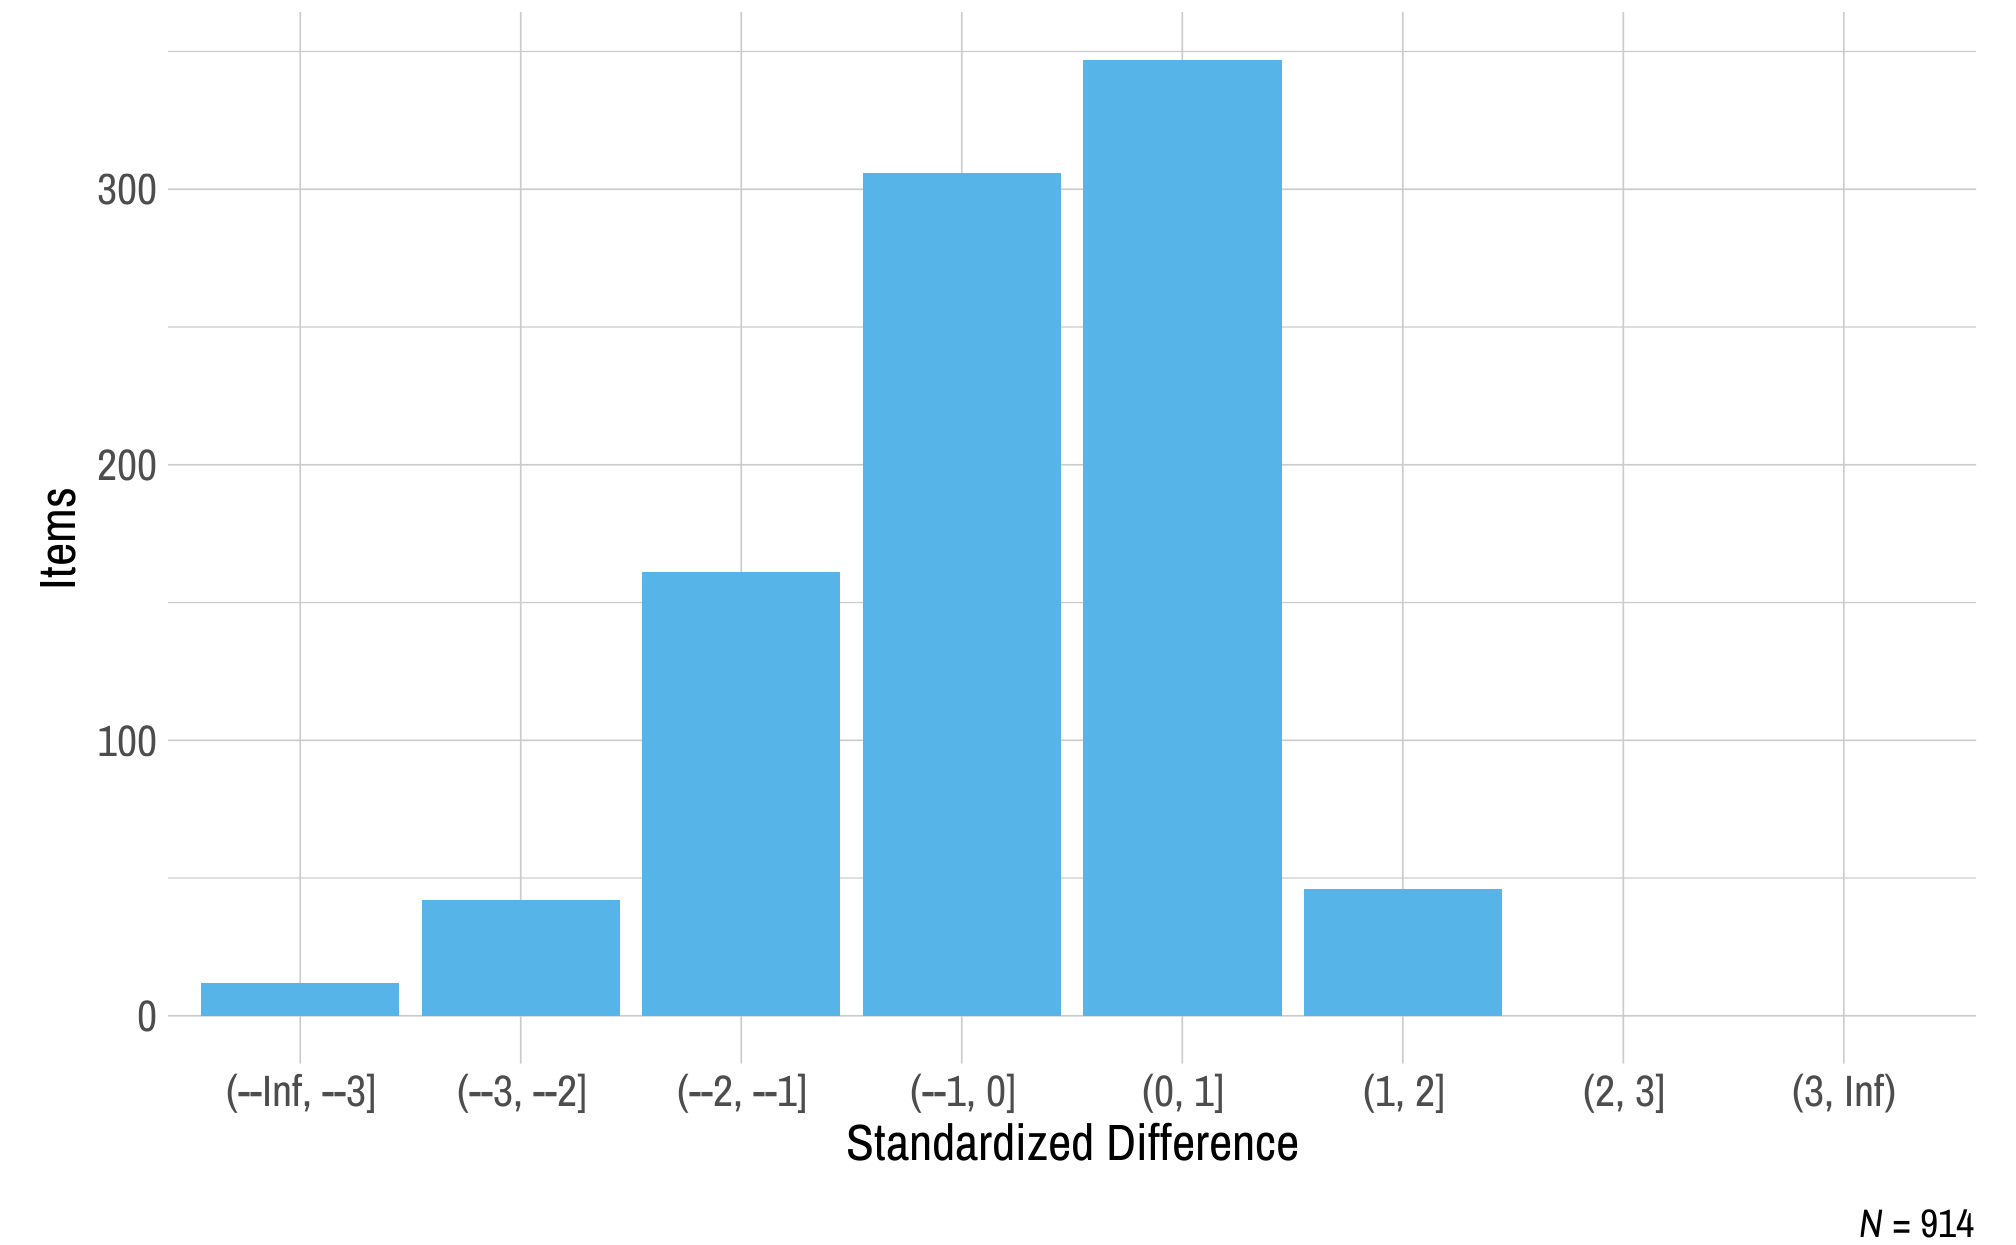
Note. Items with a sample size less than 20 were omitted.
Figure 3.4: Standardized Difference Z-Scores for Mathematics Spring 2024 and Fall 2024–2025 Field Test Items
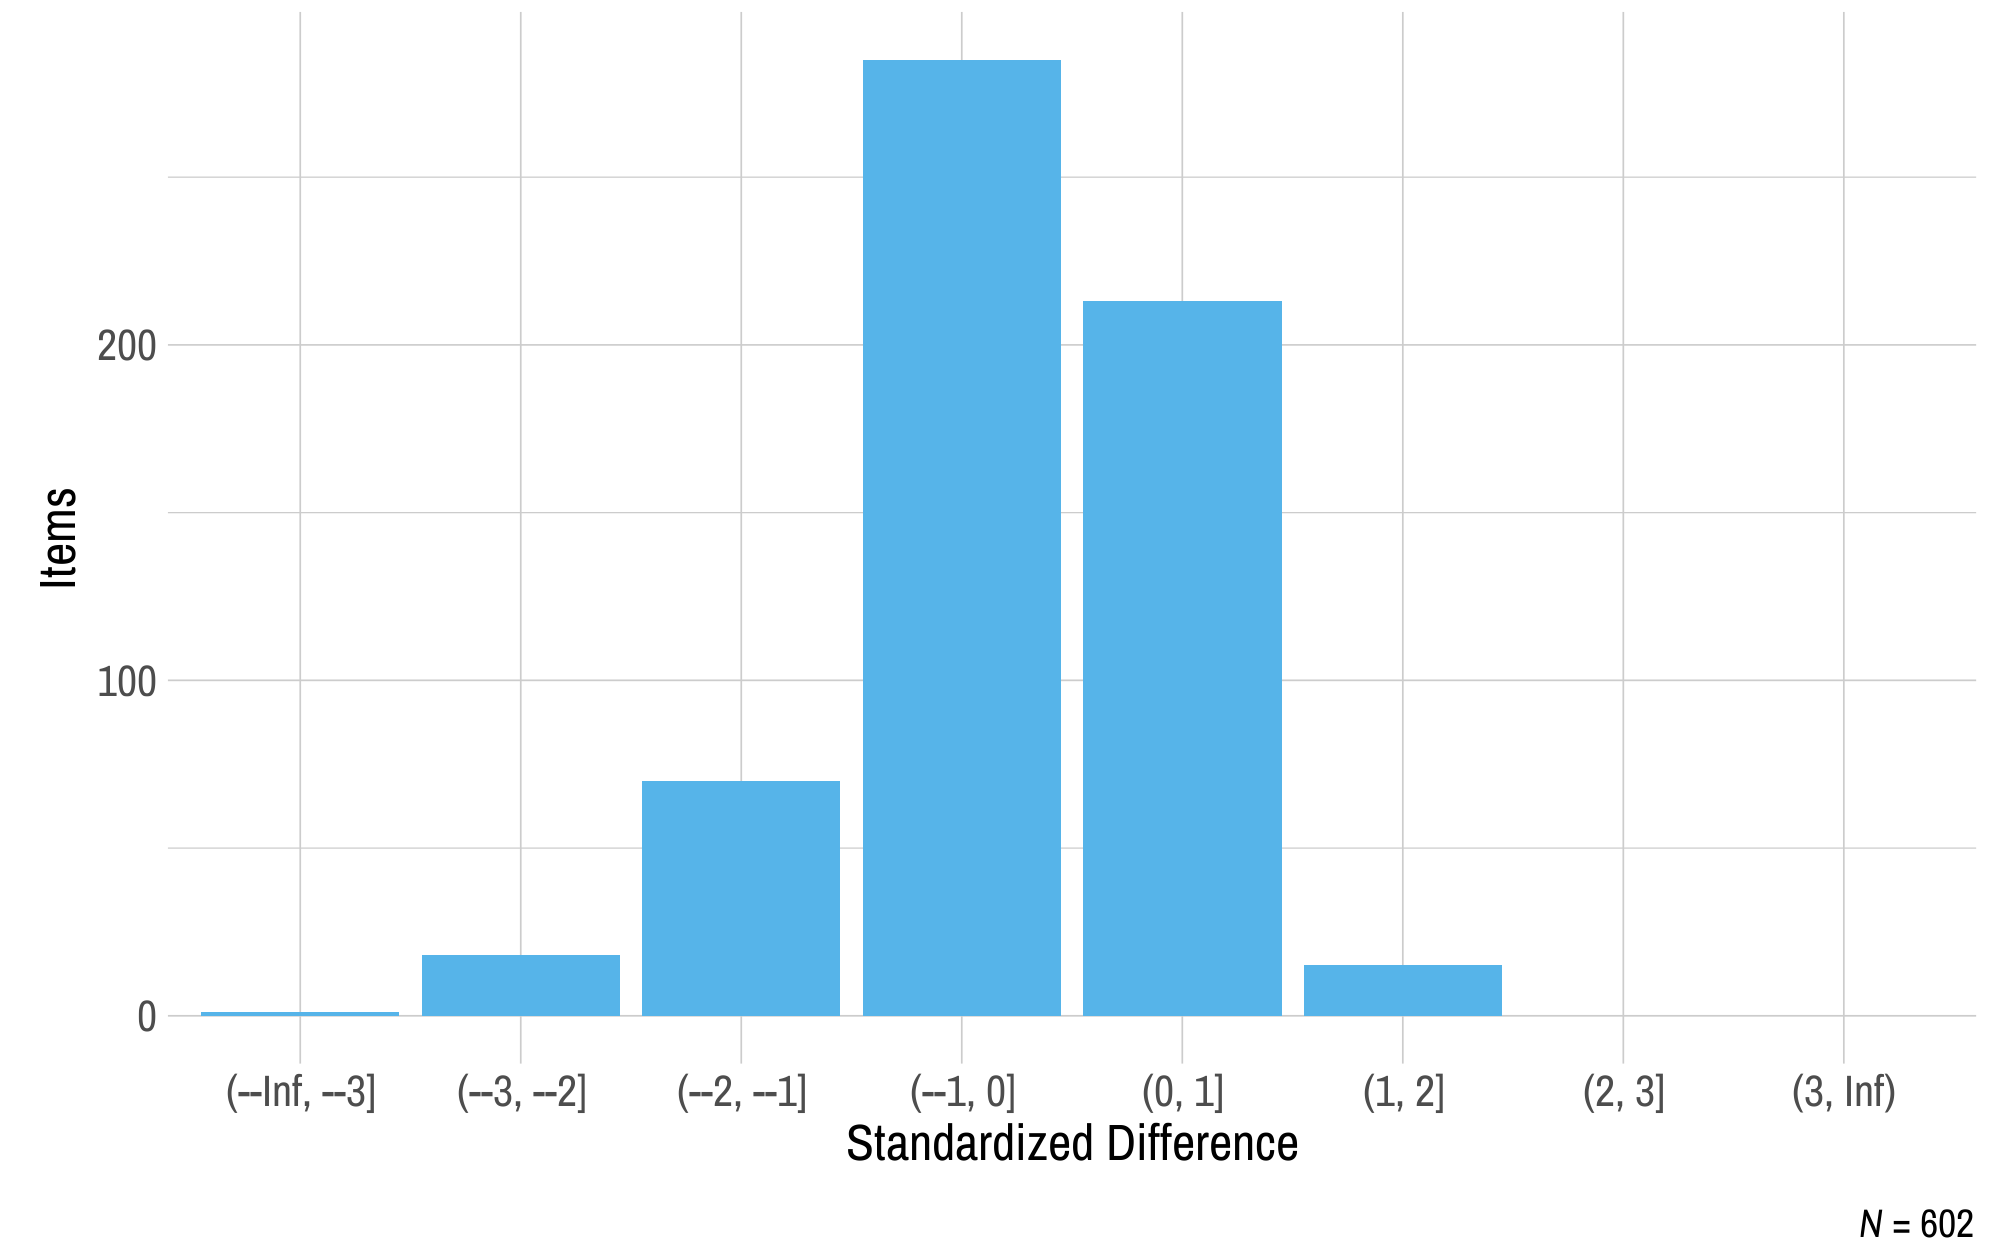
Note. Items with a sample size less than 20 were omitted.
A total of 63 (41%) ELA testlets and 37 (33%) mathematics testlets had at least one item flagged due to their p-value and/or standardized difference value. Test development teams reviewed all flagged items and their context within the testlet to identify possible reasons for the flag and to determine whether an edit was likely to resolve the issue.
Of the 63 field tested ELA testlets that were flagged, 26 (41%) were edited and reassigned to the field test pool, 21 (33%) were promoted as is to the operational pool to maintain pool depth given testlet retirement (e.g., the field tested testlet appeared to better measure the EE and linkage level than the testlet already in the operational pool; the field tested testlet was promoted to address linkage level misfit caused by existing operational testlet[s]), and 16 (25%) were rejected and retired. Of the 37 mathematics testlets that were flagged, three (8%) were edited and reassigned to the field test pool, 31 (84%) were promoted as is to the operational pool to maintain pool depth given testlet retirement, and three (8%) were rejected and retired.
Of the 89 field tested ELA testlets that were not flagged, five (6%) were edited and reassigned to the field test pool for content-based reasons (e.g., changes to item wording that were identified after field testing), 81 (91%) were promoted as is to the operational pool, and three (3%) were rejected and retired (e.g., due to issues identified after field testing). Of the 74 mathematics testlets that were not flagged, 66 (89%) were promoted as is to the operational pool and eight (11%) were rejected and retired.
Field test items were also reviewed for evidence of DIF. See Chapter 3 of the 2021–2022 Technical Manual—Year-End Model (Dynamic Learning Maps Consortium, 2022) for a complete description of the methods and process for evaluating evidence of DIF. Two field test items in ELA and one field test item in mathematics were flagged for nonnegligible DIF. All three items were reviewed by the test development teams and were designated for additional field testing to collect additional data.
3.3.2 Operational Assessment Items for 2024–2025
There were several updates to the pool of operational items for 2024–2025: 181 testlets were promoted to the operational pool from field testing, including 76 ELA testlets and 105 mathematics testlets. Additionally, 10 testlets (1% of all testlets) were retired due to model misfit. For a discussion of the model-based retirement process, see Chapter 5 of the 2021–2022 Technical Manual—Year-End Model (Dynamic Learning Maps Consortium, 2022).
Testlets were made available for operational testing in 2024–2025 based on the 2023–2024 operational pool and the promotion of testlets from field testing to the operational pool following their review. Table 3.19 summarizes the total number of operational testlets for 2024–2025. In total, there were 1,094 operational testlets available across all grades, EEs, and linkage levels. This total included 355 EE/linkage level combinations (193 ELA, 162 mathematics) for which both a general version and a version for students who are blind or visually impaired or read braille were available.
Operational assessments were administered during the spring assessment window. A total of 1,450,232 test sessions were administered during both assessment windows. One test session is one testlet taken by one student. Only test sessions that were complete at the close of each testing window counted toward the total sessions.
| Grade | English language arts (n) | Mathematics (n) |
|---|---|---|
| 3 | 82 | 52 |
| 4 | 83 | 51 |
| 5 | 76 | 52 |
| 6 | 78 | 51 |
| 7 | 79 | 45 |
| 8 | 79 | 61 |
| 9–10 | 78 | 156 |
| 11–12 | 71 | * |
| Total | 626 | 468 |
| * In mathematics, high school is banded in Grades 9–12. |
3.3.2.1 Educator Perceptions of Assessment Content
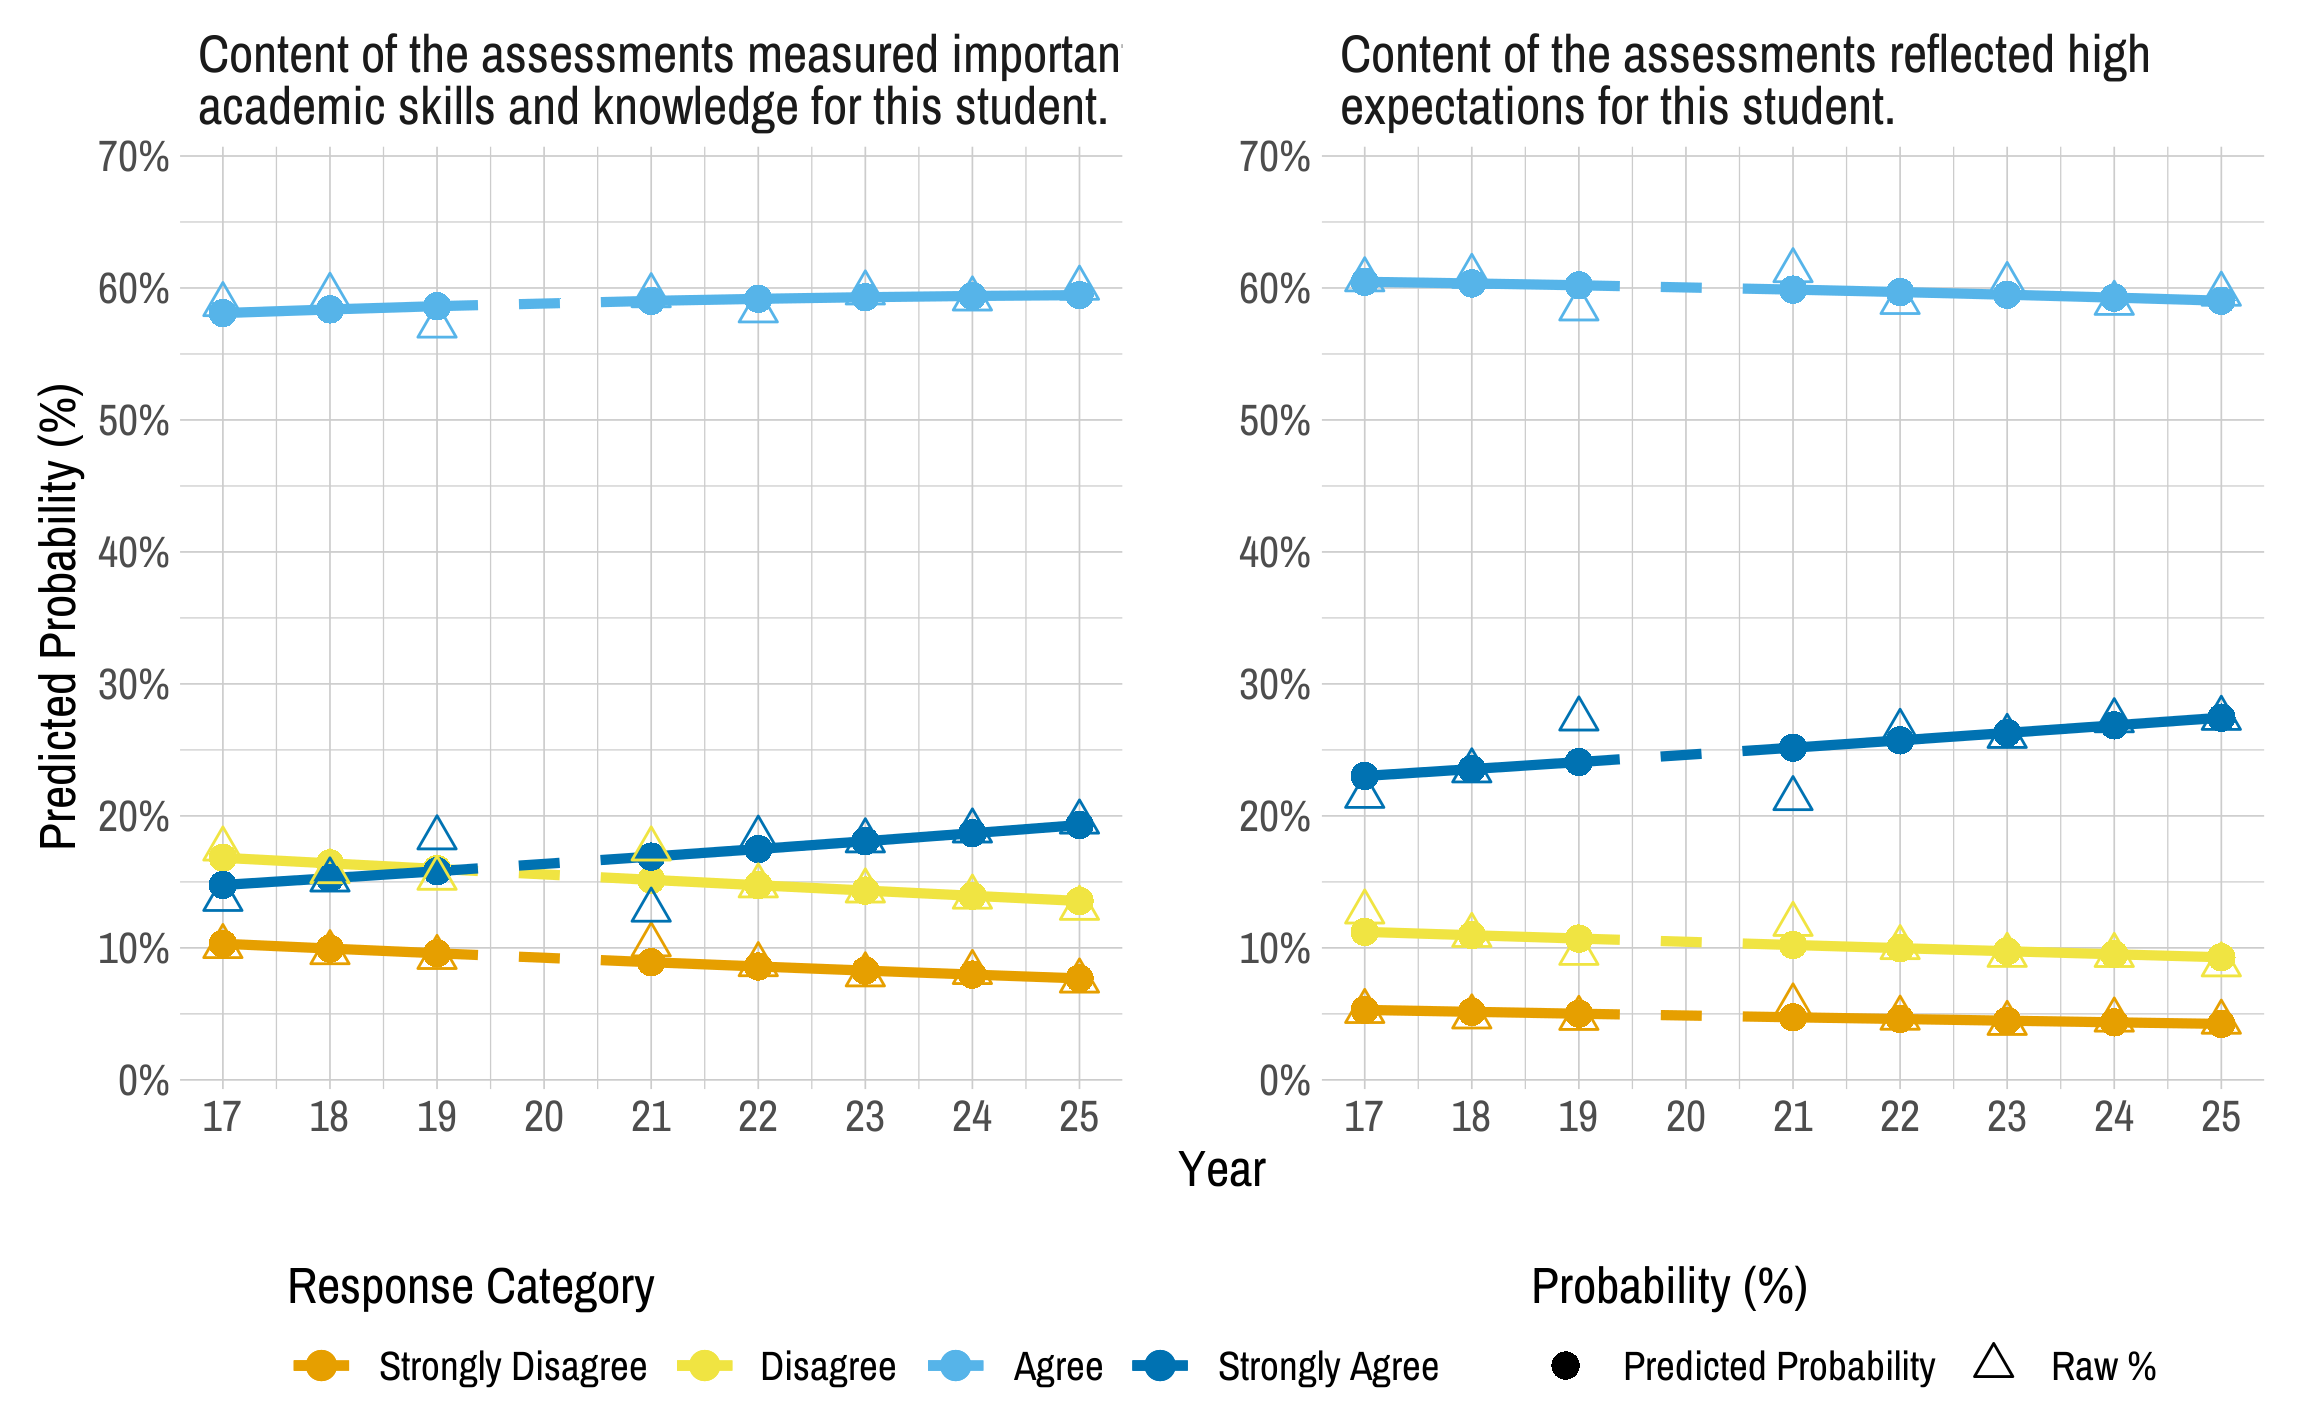
Each year, the test administrator survey includes two questions about test administrators’ perceptions of the assessment content. Participation in the test administrator survey is described in Chapter 4 of this manual. Questions pertain to whether the DLM assessments measured important academic skills and reflected high expectations for their students. Table 3.20 describes the responses.
Test administrators generally responded that content reflected high expectations for their students (87% agreed or strongly agreed) and measured important academic skills (80% agreed or strongly agreed). While the majority of test administrators agreed with these statements, 13%–20% disagreed. Test administrators’ responses may reflect awareness that DLM assessments contain challenging content. However, test administrators were divided on its importance in the educational programs of students with the most significant cognitive disabilities.
|
Strongly
disagree |
Disagree
|
Agree
|
Strongly
agree |
|||||
|---|---|---|---|---|---|---|---|---|
| Statement | n | % | n | % | n | % | n | % |
| Content measured important academic skills and knowledge for this student. | 3,488 | 7.5 | 6,054 | 13.0 | 27,930 | 60.0 | 9,094 | 19.5 |
| Content reflected high expectations for this student. | 2,022 | 4.4 | 4,031 | 8.7 | 27,587 | 59.5 | 12,704 | 27.4 |
In 2024–2025, we evaluated longitudinal trends in educator perceptions of assessment content. We used an ordered logistic regression model where \(Year\) was the predictor variable (Agresti, 2010). We employed ordered logistic regression because the Likert-scale survey responses were ordinal. The model preserves the ordinal information by estimating the cumulative odds of selecting higher versus lower categories. The model is specified as:
\[ \log \left( \frac{P(Y_{eit} \le j)}{P(Y_{eit} > j)} \right) = \alpha_{ij} + \beta_i \, Year_t \]
where \(Y_{eit}\) indicates the response of educator \(e\) to item \(i\) in year \(t\), and \(\log \left( \frac{P(Y_{eit} \le j)}{P(Y_{eit} > j)} \right)\) represents the cumulative log-odds of responding to category \(j\) or lower versus higher categories. \(\alpha_{ij}\) indicates the cut point for item \(i\)’s category \(j\). With a 4-point Likert scale, an item has three thresholds: one splitting the first and second response options, one splitting the second and third response options, and one splitting the third and fourth response options. This means \(\alpha_{i2}\) presents the boundary between the second and third response options in item \(i\). \(Year_t\) is a continuous variable representing the time (year) in which the response \(Y_{eit}\) was collected. \(\beta_i\) captures the longitudinal change in the log-odds of selecting a higher (versus lower) response category per one-year increase for item \(i\).
For interpretation, we report odds ratios derived from \(\beta_i\) with 95% confidence intervals. The odds ratios indicate the magnitude and direction of yearly change, representing the change in the odds of selecting a higher category in each subsequent year. In other words, they capture the overall tendency for responses to shift toward higher categories (e.g., moving from strongly disagree to disagree, then to agree, and finally to strongly agree) across years, rather than comparing any single pair of categories. An odds ratio of 1 indicates equal odds of responding in a higher versus lower category (i.e., no change across years). An odds ratio greater than 1 indicates increasing odds of selecting a higher category each year, while an odds ratio less than 1 indicates decreasing odds. For example, an odds ratio of 1.04 indicates a 4% increase in the odds of selecting a higher category with each additional year. Finally, after fitting the model, we calculated the predicted probability of each response category across years to illustrate how these effects translate into changes on the probability scale.
Figure 3.5 presents longitudinal trends in educator perceptions of assessment content by showing the raw percentage of each response category (triangles) and the predicted probability of selecting each category (circles) across years, separately by item. Overall, test administrators’ agreement with both statements increased significantly through 2025. The percentage of educators who strongly agreed with the statement, “Content of the assessments measured important academic skills and knowledge for this student,” increased toward 2025. Based on the results of the logistic regression analysis, the odds of selecting a higher level of agreement with the statement increased by 4.1% per year (odds ratio = 1.041, 95% CI [1.039, 1.044]). Similarly, the percentage of educators who strongly agreed with the statement, “Content of the assessments reflected high expectations for this student,” increased toward 2025. The odds of selecting a higher level of agreement with the statement increased by 3% per year (odds ratio = 1.03, 95% CI [1.027, 1.032]). The consistent positive trends across items and years indicate incremental improvements in test administrators’ perceptions of assessment content.
Figure 3.5: Longitudinal Trends in Educator Perceptions of Assessment Content
3.3.2.2 Psychometric Properties of 2024–2025 Operational Assessment Items
To summarize information about item difficulty, p-values were calculated for all operational items with all of the data used to calibrate the scoring model. Data for evaluating the psychometric properties of the operational items were consistent with the calibration. Specifically, data from 2020–2021, 2021–2022, and 2022–2023 were included along with data from prior years for linkage levels where the combined sample size for those 3 years was less than 250. For more information on the calibration for scoring, see Chapter 5 of the 2021–2022 Technical Manual—Year-End Model (Dynamic Learning Maps Consortium, 2022).
Figure 3.6 and Figure 3.7 show the distribution of p-values for operational items in ELA and mathematics, respectively. To prevent items with small sample sizes from potentially skewing the results, the sample size cutoff for inclusion in the p-value plots was 20. In total, seven items (<1% of all items) were excluded due to small sample size, where seven of the items were ELA items (<1% of all ELA items) and zero of the items were mathematics items (<1% of all mathematics items). Of the excluded items, 7 (100%) items for ELA were at the Successor linkage level. In general, ELA items were easier than mathematics items, as evidenced by the presence of more items in the higher-bin (p-value) ranges.
Figure 3.6: p-values for English Language Arts 2024–2025 Operational Items
Note. Items with a sample size less than 20 were omitted.
Figure 3.7: p-values for Mathematics 2024–2025 Operational Items
Note. Items with a sample size less than 20 were omitted.
We use standardized difference values to evaluate the fungibility assumption because items are designed and developed to be fungible. Standardized difference values were calculated for all operational items, with a student sample size of at least 20 required to compare the p-value for the item to all other items measuring the same EE and linkage level. If an item is fungible with the other items measuring the same EE and linkage level, the item is expected to have a nonsignificant standardized difference value. The standardized difference values provide one source of evidence of internal consistency.
Figure 3.8 and Figure 3.9 summarize the distributions of standardized difference values for operational items in ELA and mathematics, respectively. Of all items measuring the EE and linkage level, >99% of ELA items and >99% of mathematics items fell within two standard deviations of the mean.
Figure 3.8: Standardized Difference Z-Scores for English Language Arts 2024–2025 Operational Items
Note. Items with a sample size less than 20 were omitted.
Figure 3.9: Standardized Difference Z-Scores for Mathematics 2024–2025 Operational Items
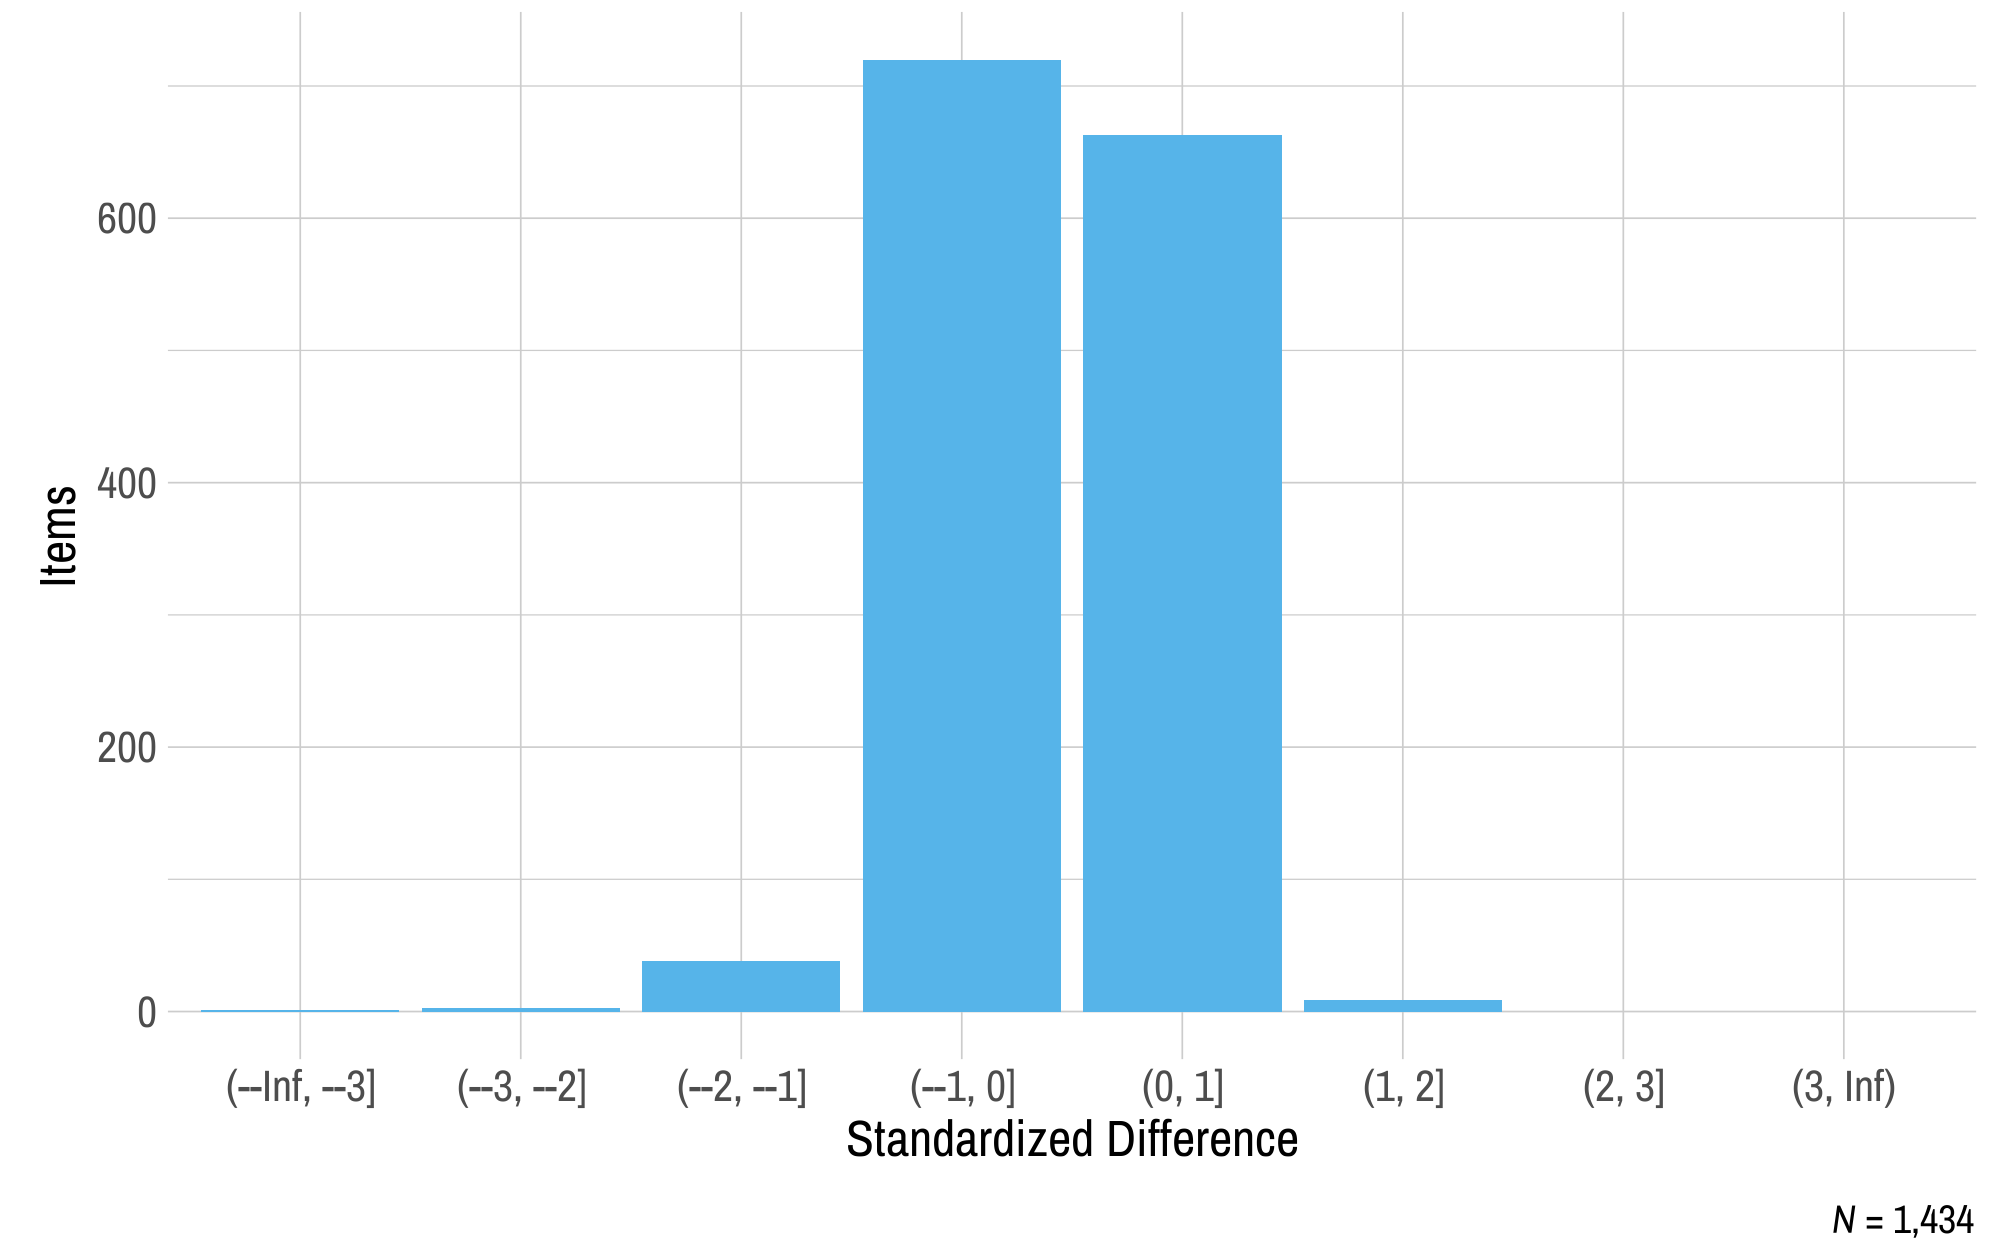
Note. Items with a sample size less than 20 were omitted.
Figure 3.10 summarizes the distributions of standardized difference values for operational items by linkage level. Most items fell within two standard deviations of the mean of all items measuring the respective EE and linkage level. The Successor linkage level has a slightly different distribution of standardized difference values than the other linkage levels. The difference in the distribution may be due to the smaller sample sizes for items measuring the Successor linkage level. This is consistent with the examination of items excluded from analysis where the majority of items excluded due to small sample sizes were measuring the Successor linkage level. As additional data are collected and decisions are made regarding item pool replenishment, test development teams will consider item standardized difference values, along with item misfit analyses, when determining which items and testlets are recommended for retirement.
Figure 3.10: Standardized Difference Z-Scores for 2024–2025 Operational Items by Linkage Level
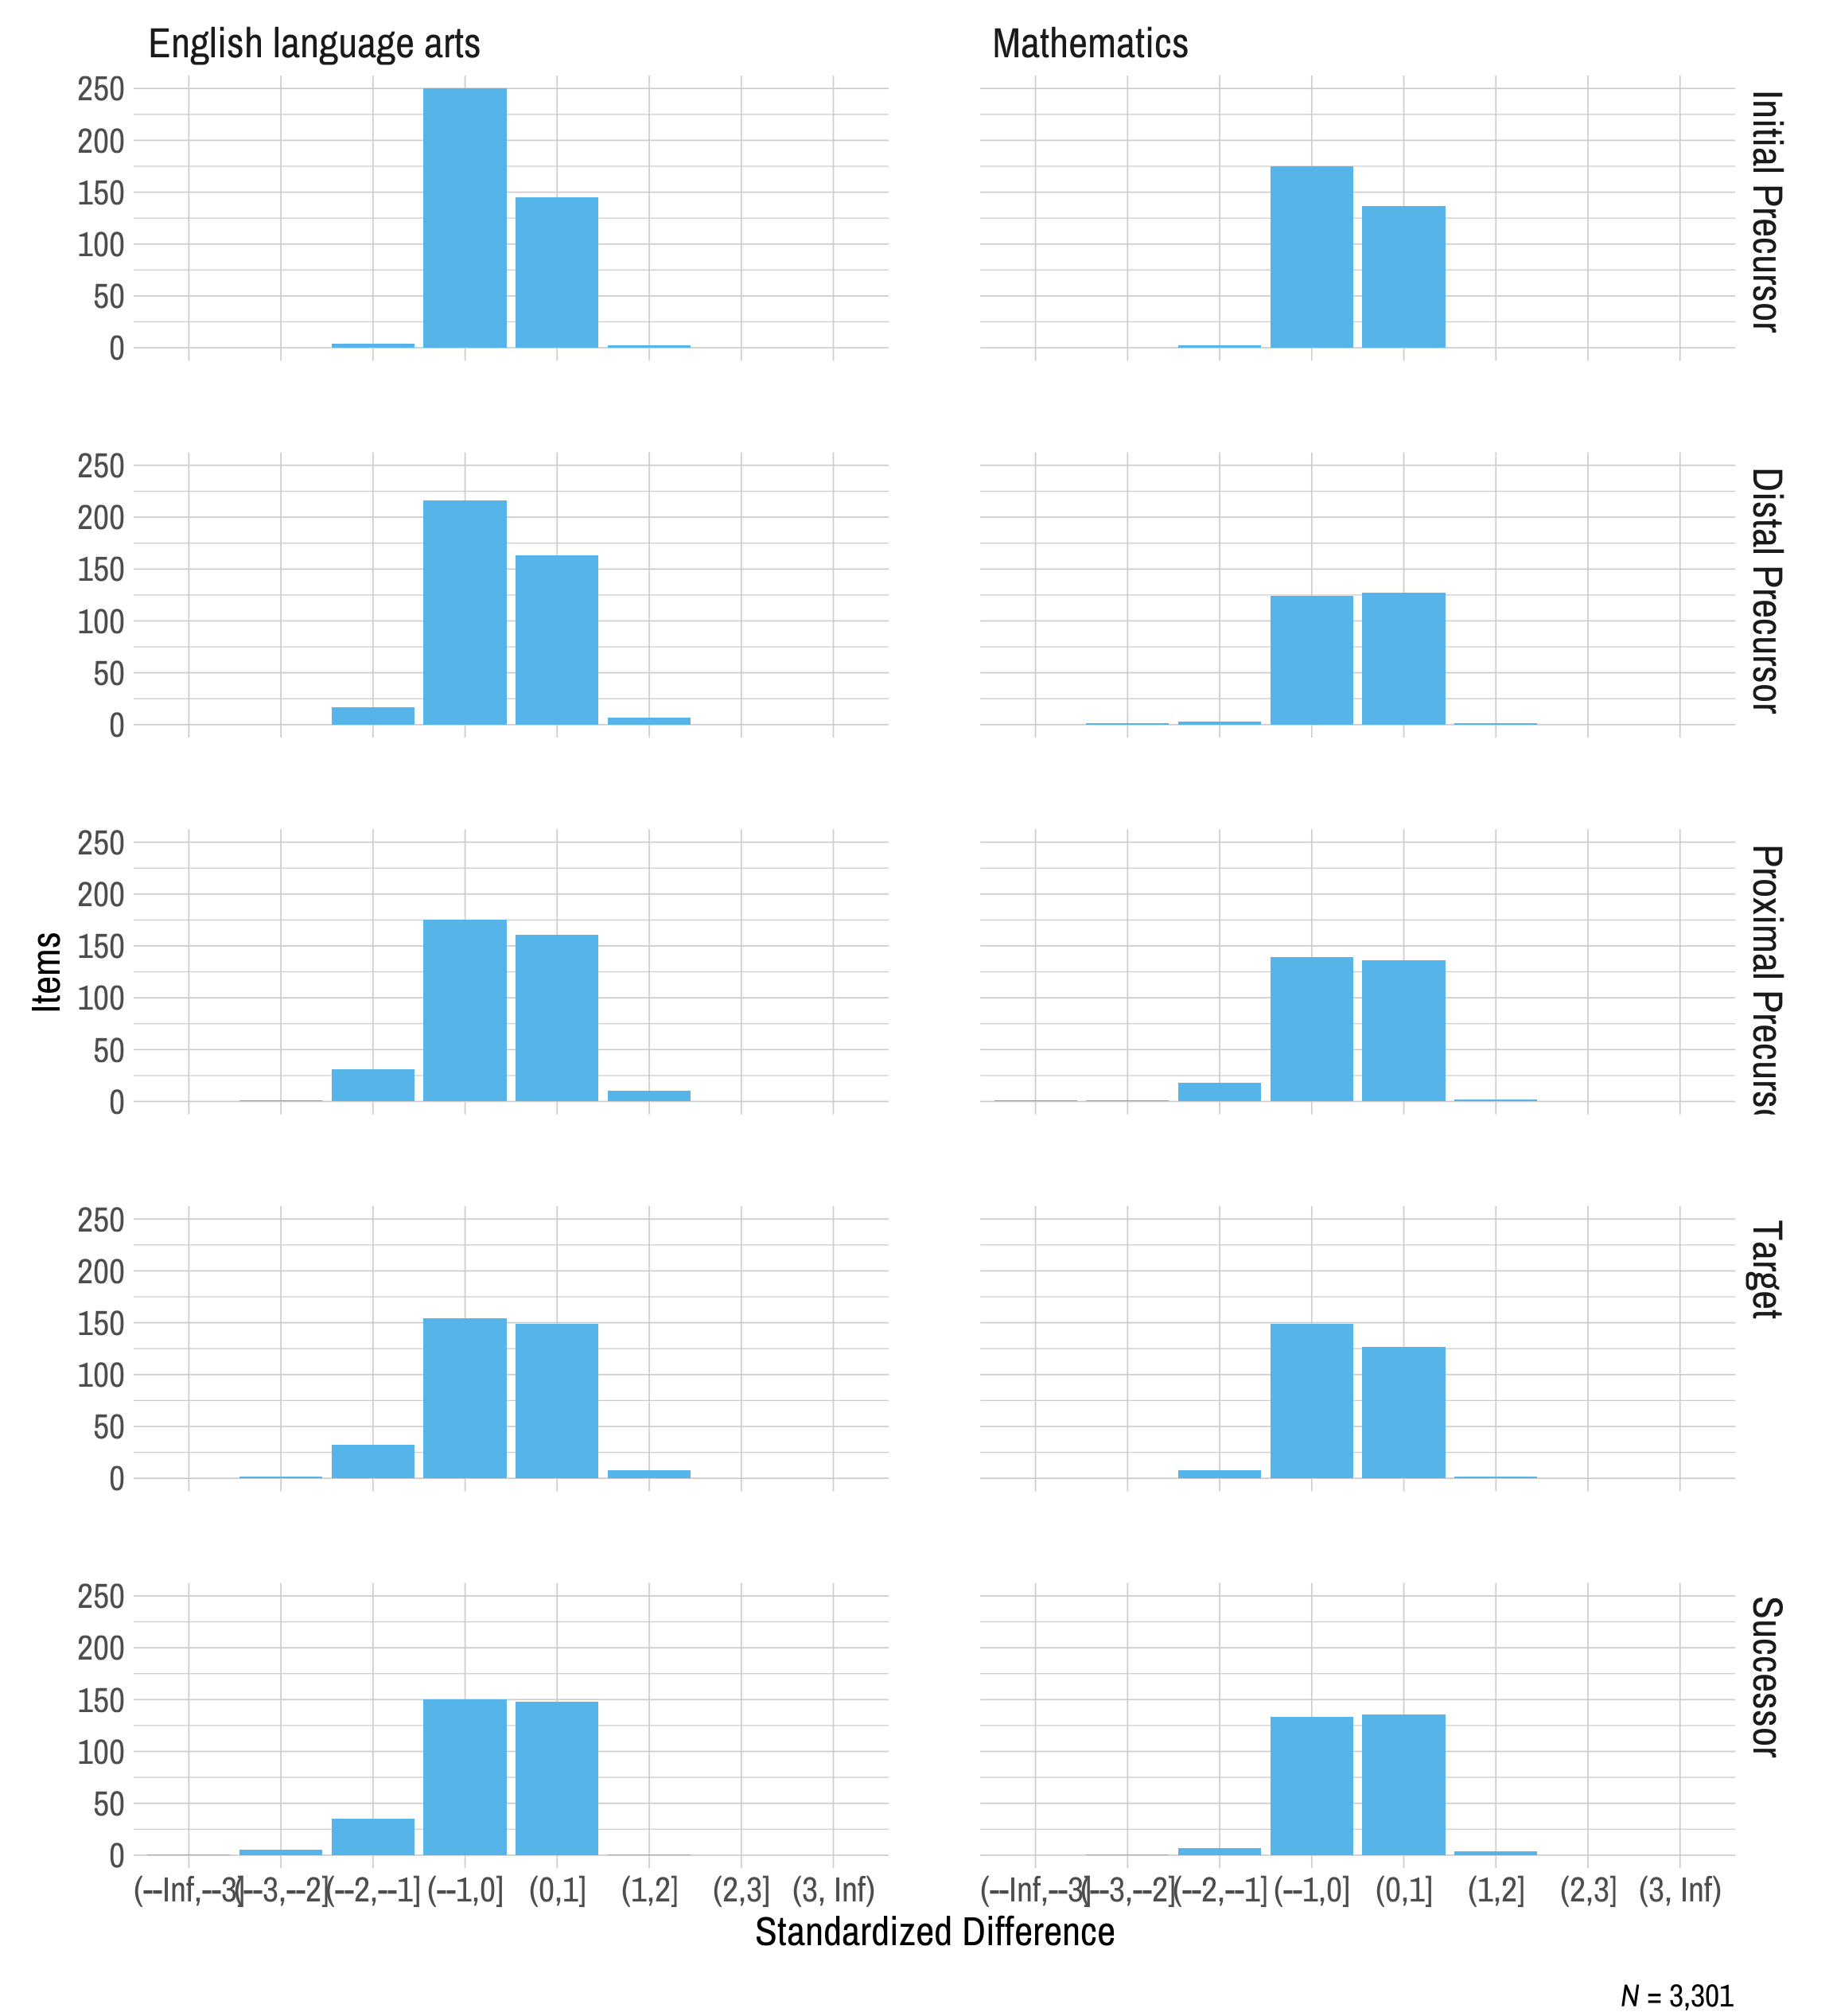
Note. Items with a sample size less than 20 were omitted.
3.3.3 Evaluation of Item-Level Bias
Operational items were reviewed for evidence of DIF. See Chapter 3 of the 2021–2022 Technical Manual—Year-End Model (Dynamic Learning Maps Consortium, 2022) for a complete description of the inclusion criteria, methods, and interpretation guidelines for evaluating evidence of DIF.
3.3.3.1 DIF Results
There were 2,988 (94%) items evaluated for at least one gender group comparison. The number of items evaluated by grade and subject for gender ranged from 12 in Grades 11–12 ELA to 308 in Grades 9–10 mathematics. Because students taking DLM assessments represent three possible gender groups (male, female, and nonbinary/undesignated), there are up to two comparisons that can be made for each item, with the male group as the reference group and each of the other two groups as the focal group. Across all items, this resulted in 6,340 possible comparisons. Using the inclusion criteria specified above, 2,988 (47%) item and focal group comparisons were included in the analysis. All 2,988 items were evaluated for the female focal group. No items met the focal group sample size criteria for the nonbinary/undesignated focal group.
There were 2,916 (92%) items evaluated for at least one racial group comparison. The number of items evaluated by grade and subject for race ranged from 12 in Grades 11–12 ELA to 288 in Grades 9–10 mathematics. Because students taking DLM assessments represent seven possible racial groups (White, African American, Asian, American Indian, Native Hawaiian or Pacific Islander, Alaska Native, and two or more races), See Chapter 7 of this manual for a summary of participation by race and other demographic variables. there are up to six comparisons that can be made for each item, with the White group as the reference group and each of the other six groups as the focal group. Across all items, this results in 19,020 possible comparisons. Using the inclusion criteria specified above, 9,042 (48%) item and focal group comparisons were included in the analysis. Overall, 88 items were evaluated for one racial focal group, 666 items were evaluated for two racial focal groups, 1,041 items were evaluated for three racial focal groups, 1,106 items were evaluated for four racial focal groups, and 15 items were evaluated for five racial focal groups. One racial focal group and the White reference group were used in each comparison. Table 3.21 shows the number of items that were evaluated for each racial focal group. Across all gender and race comparisons, sample sizes for each comparison ranged from 295 to 21,143 for gender and from 406 to 16,165 for race.
| Focal group | Items (n) |
|---|---|
| African American | 2,916 |
| American Indian | 1,125 |
| Asian | 2,158 |
| Native Hawaiian or Pacific Islander | 15 |
| Two or more races | 2,828 |
| Note. The reference group was White students. |
3.3.3.1.1 Uniform DIF Model
A total of 540 (18%) items for gender were flagged for evidence of uniform DIF. Using the Zumbo and Thomas (1997) effect-size classification criteria, all but one combination were found to have a negligible effect-size change after the gender term was added to the regression equation. When using the Jodoin and Gierl (2001) effect-size classification criteria, all but one combination were found to have a negligible effect-size change after the gender term was added to the regression equation.
Additionally, 1,364 (15%) item and focal group combinations across 1,046 items for race were flagged for evidence of uniform DIF. Using the Zumbo and Thomas (1997) effect-size classification criteria, all but two combinations were found to have a negligible effect-size change after the race term was added to the regression equation. When using the Jodoin and Gierl (2001) effect-size classification criteria, all but two combinations were found to have a negligible effect-size change after the race term was added to the regression equation.
Table 3.22 and Table 3.23 summarize the total number of combinations flagged for evidence of nonnegligible uniform DIF by subject and grade for gender and race, respectively. The percentage of combinations flagged ranged from 0% to <1% for gender and from 0% to <1% for race.
| Grade | Items flagged (n) | Total items (N) | Items flagged (%) | Items with moderate or large effect size (n) |
|---|---|---|---|---|
| English language arts | ||||
| 3 | 33 | 202 | 16.3 | 0 |
| 4 | 28 | 203 | 13.8 | 0 |
| 5 | 29 | 201 | 14.4 | 0 |
| 6 | 51 | 220 | 23.2 | 0 |
| 7 | 41 | 210 | 19.5 | 0 |
| 8 | 24 | 196 | 12.2 | 0 |
| 9 | 10 | 58 | 17.2 | 0 |
| 10 | 9 | 23 | 39.1 | 0 |
| 11 | 39 | 186 | 21.0 | 0 |
| 9–10 | 18 | 126 | 14.3 | 0 |
| 11–12 | 2 | 12 | 16.7 | 0 |
| Total | 284 | 1,637 | 17.3 | 0 |
| Mathematics | ||||
| 3 | 28 | 125 | 22.4 | 0 |
| 4 | 28 | 141 | 19.9 | 0 |
| 5 | 31 | 155 | 20.0 | 0 |
| 6 | 28 | 148 | 18.9 | 0 |
| 7 | 32 | 128 | 25.0 | 0 |
| 8 | 43 | 202 | 21.3 | 1 |
| 9 | 25 | 154 | 16.2 | 0 |
| 10 | 14 | 154 | 9.1 | 0 |
| 11–12 | 27 | 144 | 18.8 | 0 |
| Total | 256 | 1,351 | 18.9 | 1 |
| Grade | Items flagged (n) | Total items (N) | Items flagged (%) | Items with moderate or large effect size (n) |
|---|---|---|---|---|
| English language arts | ||||
| 3 | 91 | 605 | 15.0 | 0 |
| 4 | 104 | 642 | 16.2 | 0 |
| 5 | 80 | 612 | 13.1 | 0 |
| 6 | 106 | 706 | 15.0 | 0 |
| 7 | 106 | 668 | 15.9 | 0 |
| 8 | 87 | 635 | 13.7 | 0 |
| 9 | 25 | 149 | 16.8 | 0 |
| 10 | 20 | 74 | 27.0 | 0 |
| 11 | 92 | 531 | 17.3 | 0 |
| 9–10 | 83 | 359 | 23.1 | 1 |
| 11–12 | 4 | 36 | 11.1 | 0 |
| Total | 798 | 5,017 | 15.9 | 1 |
| Mathematics | ||||
| 3 | 87 | 417 | 20.9 | 0 |
| 4 | 52 | 497 | 10.5 | 0 |
| 5 | 69 | 529 | 13.0 | 0 |
| 6 | 75 | 481 | 15.6 | 0 |
| 7 | 54 | 414 | 13.0 | 0 |
| 8 | 103 | 632 | 16.3 | 1 |
| 9 | 39 | 365 | 10.7 | 0 |
| 10 | 43 | 308 | 14.0 | 0 |
| 11–12 | 44 | 382 | 11.5 | 0 |
| Total | 566 | 4,025 | 14.1 | 1 |
Table 3.24 provides information about the flagged items with a nonnegligible effect-size change after the addition of the group term, as represented by a value of B (moderate) or C (large). The test development team reviews all items flagged with a moderate or large effect size. The \(\beta_2G\) values (i.e., the coefficients for the group term) in Table 3.24 indicate which group was favored on the item after accounting for total linkage levels mastered, with positive values indicating that the focal group had a higher probability of success on the item and negative values indicating that the focal group had a lower probability of success on the item. The focal group was favored on none of the combinations.
| Item ID | Focal | Grade | EE | \(\chi^2\) | \(p\)-value | \(\beta_2G\) | \(R^2\) | Z&T* | J&G* |
|---|---|---|---|---|---|---|---|---|---|
| English language arts | |||||||||
| 37778 | Two or more races | 9–10 | ELA.EE.RL.9-10.3 | 22.09 | <.001 | −0.38 | .749 | C | C |
| Mathematics | |||||||||
| 50337 | Female | 8 | M.EE.8.EE.7 | 25.65 | <.001 | −0.29 | .823 | C | C |
| 8795 | African American | 8 | M.EE.8.G.9 | 7.63 | .006 | −0.15 | .850 | C | C |
| Note. ID = identification; EE = Essential Element; \(\beta_2G\) = the coefficient for the group term in the logistic regression DIF detection method; Z&T = Zumbo & Thomas; J&G = Jodoin & Gierl. | |||||||||
| * Effect-size measure: A indicates evidence of negligible DIF, B indicates evidence of moderate DIF, and C indicates evidence of large DIF. | |||||||||
3.3.3.1.2 Nonuniform DIF Model
A total of 617 (21%) items for gender were flagged for evidence of nonuniform DIF. Using the Zumbo and Thomas (1997) effect-size classification criteria, all but one combination were found to have a negligible effect-size change after the gender and interaction terms were added to the regression equation. When using the Jodoin and Gierl (2001) effect-size classification criteria, all but one combination were found to have a negligible effect-size change after the gender and interaction terms were added to the regression equation.
Additionally, 1,519 (17%) item and focal group combinations across 1,156 items were flagged for evidence of nonuniform DIF when both the race and interaction terms were included in the regression equation. Using the Zumbo and Thomas (1997) effect-size classification criteria, all but four combinations were found to have a negligible effect-size change after the race and interaction terms were added to the regression equation. When using the Jodoin and Gierl (2001) effect-size classification criteria, all but four combinations were found to have a negligible effect-size change after the race and interaction terms were added to the regression equation.
Table 3.25 and Table 3.26 summarize the number of combinations flagged for nonnegligible effect-size change by subject and grade. The percentage of combinations flagged ranged from 0% to <1% for gender and from 0% to <1% for race.
| Grade | Items flagged (n) | Total items (N) | Items flagged (%) | Items with moderate or large effect size (n) |
|---|---|---|---|---|
| English language arts | ||||
| 3 | 31 | 202 | 15.3 | 0 |
| 4 | 36 | 203 | 17.7 | 0 |
| 5 | 39 | 201 | 19.4 | 0 |
| 6 | 58 | 220 | 26.4 | 0 |
| 7 | 42 | 210 | 20.0 | 0 |
| 8 | 30 | 196 | 15.3 | 0 |
| 9 | 13 | 58 | 22.4 | 0 |
| 10 | 7 | 23 | 30.4 | 0 |
| 11 | 44 | 186 | 23.7 | 0 |
| 9–10 | 17 | 126 | 13.5 | 0 |
| 11–12 | 3 | 12 | 25.0 | 0 |
| Total | 320 | 1,637 | 19.5 | 0 |
| Mathematics | ||||
| 3 | 26 | 125 | 20.8 | 0 |
| 4 | 39 | 141 | 27.7 | 0 |
| 5 | 30 | 155 | 19.4 | 0 |
| 6 | 37 | 148 | 25.0 | 0 |
| 7 | 38 | 128 | 29.7 | 0 |
| 8 | 47 | 202 | 23.3 | 1 |
| 9 | 32 | 154 | 20.8 | 0 |
| 10 | 17 | 154 | 11.0 | 0 |
| 11–12 | 31 | 144 | 21.5 | 0 |
| Total | 297 | 1,351 | 22.0 | 1 |
| Grade | Items flagged (n) | Total items (N) | Items flagged (%) | Items with moderate or large effect size (n) |
|---|---|---|---|---|
| English language arts | ||||
| 3 | 98 | 605 | 16.2 | 0 |
| 4 | 109 | 642 | 17.0 | 0 |
| 5 | 89 | 612 | 14.5 | 1 |
| 6 | 107 | 706 | 15.2 | 1 |
| 7 | 99 | 668 | 14.8 | 0 |
| 8 | 88 | 635 | 13.9 | 0 |
| 9 | 27 | 149 | 18.1 | 0 |
| 10 | 17 | 74 | 23.0 | 0 |
| 11 | 95 | 531 | 17.9 | 0 |
| 9–10 | 82 | 359 | 22.8 | 1 |
| 11–12 | 6 | 36 | 16.7 | 0 |
| Total | 817 | 5,017 | 16.3 | 3 |
| Mathematics | ||||
| 3 | 95 | 417 | 22.8 | 0 |
| 4 | 71 | 497 | 14.3 | 0 |
| 5 | 89 | 529 | 16.8 | 0 |
| 6 | 83 | 481 | 17.3 | 0 |
| 7 | 86 | 414 | 20.8 | 0 |
| 8 | 115 | 632 | 18.2 | 1 |
| 9 | 47 | 365 | 12.9 | 0 |
| 10 | 50 | 308 | 16.2 | 0 |
| 11–12 | 66 | 382 | 17.3 | 0 |
| Total | 702 | 4,025 | 17.4 | 1 |
Table 3.27 summarizes information about the flagged items with a nonnegligible change in effect size after adding both the group and interaction term, where B indicates a moderate effect size and C a large effect size. In total, five combinations had a large effect size. The \(\beta_3\text{X}G\) values in Table 3.27 indicate which group was favored at lower and higher numbers of linkage levels mastered. A total of two combinations favored the focal group at higher numbers of total linkage levels mastered and the reference group at lower numbers of total linkage levels mastered.
| Item ID | Focal | Grade | EE | \(\chi^2\) | \(p\)-value | \(\beta_2G\) | \(\beta_3\text{X}G\) | \(R^2\) | Z&T* | J&G* |
|---|---|---|---|---|---|---|---|---|---|---|
| English language arts | ||||||||||
| 14515 | Asian | 5 | ELA.EE.RI.5.4 | 8.62 | .013 | −0.47 | 0.11 | .712 | C | C |
| 32760 | African American | 6 | ELA.EE.L.6.5.b | 7.14 | .028 | 0.05 | −0.03 | .718 | C | C |
| 37778 | Two or more races | 9–10 | ELA.EE.RL.9-10.3 | 22.70 | <.001 | −0.29 | −0.01 | .749 | C | C |
| Mathematics | ||||||||||
| 50337 | Female | 8 | M.EE.8.EE.7 | 25.75 | <.001 | −0.26 | 0.00 | .823 | C | C |
| 8795 | African American | 8 | M.EE.8.G.9 | 7.75 | .021 | −0.17 | 0.01 | .850 | C | C |
| Note. ID = identification; EE = Essential Element; \(\beta_2G\) = the coefficient for the group term in the logistic regression DIF detection method; \(\beta_3G\) = coefficient for the interaction between the number of linkage levels mastered term and the group term; Z&T = Zumbo & Thomas; J&G = Jodoin & Gierl. | ||||||||||
| * Effect-size measure: A indicates evidence of negligible DIF, B indicates evidence of moderate DIF, and C indicates evidence of large DIF. | ||||||||||
The test development team reviews all items flagged with a moderate or large effect size. The results of these reviews may be used to prioritize items and testlets for retirement. Updates to the operational pool, including retirements based on the results of these reviews, will be included in the 2025–2026 technical manual update. See section 3.3.2 for updates to the operational pool, which includes updates based on the reviews of items flagged for evidence of nonnegligible DIF presented in the 2023–2024 technical manual update.
3.4 Conclusion
During 2024–2025, the test development teams conducted a virtual item-writing workshop and an on-site external review event. Overall, 311 testlets were written for ELA and mathematics, and 518 testlets were externally reviewed. Following external review, the test development team promoted 100% and 99% of ELA and mathematics testlets, respectively, to field testing. We field-tested 322 testlets across grades, subjects, and windows, and 199 (62%) testlets were promoted to the operational pool. Of the testlets already in the operational pool, 3,301 (>99%) items had p-values within two standard deviations of the mean for the EE and linkage level, 2,985 (>99%) items were not flagged for nonnegligible uniform DIF, and 2,983 (>99%) items were not flagged for nonnegligible nonuniform DIF.